Trend is one of the key concepts in trading. In the early stages of training, every trader has heard a phrase, ”Trend is your friend.” But is that so? In today’s article, we will try to get to the bottom of it and figure out whether it does make sense to follow the trend.
1. Trend is a general direction the market is taking
2. Trend direction: How to not make a mistake
3. Why trends get formed
4. How to trade trends the right way
5. Trend is your friend: Go along with it
The word “trend” is used in the context of technical analysis of financial markets. Charles Dow is considered to be the founder of the price behavior analysis. In his theory, he outlined a number of principles, some of which are related to trends.
According to Dow, market prices follow a certain trend most of the time.
INTERESTING FACT:
It has been pointed out that the trend is likely to continue rather than change its direction. When the trend begins to show the signs of changing, the market itself will give a reversal signal.
The majority of trading strategies and techniques are based on technical analysis of the charts. The very fact that the price includes everything makes the chart sufficient for accurate identification of entry points.
Below we are going to take a closer look at several aspects of this topic, namely the types of trends and how to identify and trade them correctly.
There are three types of market trends, namely ascending (uptrend), descending (downtrend) and horizontal (sideways). In the ascending trend, the price grows more than it drops. In other words, there is a key upward direction, while downward price movements are considered to be rollbacks.
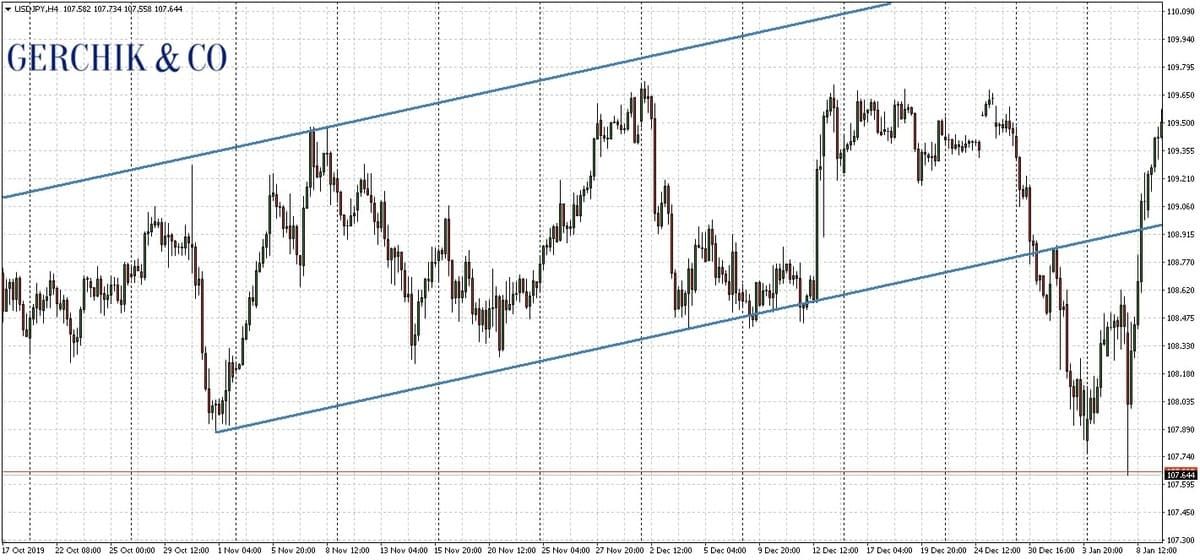
Trends are typically marked by channels and trend lines on the chart. The ascending channel is drawn along two successively ascending lows and a high between them. The lower boundary of the ascending channel is called the trend line and serves as its support level. The upper boundary is called the line of the channel. It limits the trend width and can change if the channel expands.
.jpeg)
In the descending channel, the price drops more than it grows. The descending channel on the chart is drawn along the two successively decreasing highs and a low between them. We get two parallel lines.
The top boundary in the descending channel is called the trend line, serving as a resistance level. The lower boundary i.e. support of the downtrend, is called the channel line.
.jpeg)
There is also a sideways trend which has two horizontal lines, the lower one being the support, and the upper one serving as the resistance.
In the sideways trend, commonly known as a flat or a horizontal trend, the price is bouncing back and forth between support and resistance.
.jpeg)
In essence, the answer to the question “What is trend?” will be an explanation of the prevailing market trend.
Why do trends emerge? This is explained by the market players’ psychology, as well as their actions i.e. order placement, prices at which trades are made, large volumes, etc. Everyone is familiar with the laws of technical analysis and can see the trend. That way traders can decide which step to take in a particular situation.
Here’s a simplified example to illustrate this. Let’s assume that most traders expect a certain financial instrument to go up in value because there are favorable conditions for it.
As this happens, they start buying the instrument massively, thus pushing the price up. Over time, buyers begin to close long positions, and there is a surge in sales in the market. That’s how the downward rollback emerges on the chart. At some point, the buyers will join in again, and the asset price will go up.
Thus, a series of successively ascending lows and highs is observed. In other words, the uptrend is forming on the chart.

So, why is the trend your friend when it comes to the financial markets? The answer is simple - because the price moves chiefly in the direction of the prevailing trend. When you see the ascending or descending channel being formed on the chart, you should open trades in its direction.
By using the trend trading strategy, you go long from the support level of the ascending channel and open short positions from the resistance level of the descending channel. When there is the sideways trend, you can buy from support and sell from resistance. Let's examine this more closely.
If you notice two consecutively ascending lows on the chart and draw the lines of the ascending channel, a rebound from the third point near the support line will serve as the first signal to open a trade.
When you notice the price bouncing upwards from the trend line for the third time, this is going to be your signal to go long. At the same time, we will take profit at the resistance line. It is better to place the take profit slightly below the upper boundary of the ascending channel.
Stop loss should be placed behind the previous low or slightly below the third point near the support line. Take a cue from both market requirements and the stop loss and take profit ratio for a trade. It should be at least 1:2.
If a descending trend is formed on the chart, open a short position from the third point of the bounce downwards from the resistance line. Make sure to place the stop loss above the previous high or above the third point of the trend line touch. Take profit when the price reaches the support line of the descending channel. Place the take profit a little before reaching it.
When trading trends, keep in mind that the further from the third point the next bounce from the trend line is, the higher the odds of a trend reversal. This means that you can still open a trade during a bounce from the fourth point by placing the take profit at the level of the previous extremum. Meanwhile, the movement according to the trend from the fifth and sixth points is questionable.
As far as the countertrend trading strategies go, one of them implies position opening at the breakout of the trend line. With the ascending trend, if the price breaks out the support line, wait for the confirmation by its rollback and open a short position.
In cases where the price breaks out the upper boundary of the descending trend, you can go long once it is confirmed by the rollback.
In this article, we have covered the topic of trend and its types, and figured out how to pinpoint it and trade within its boundaries.
That being said, it is not recommended to trade on rollbacks against the trend if we are talking about the sideways trend, of course. There is a high likelihood that the price will go against you in case of long positions in the descending trend and short positions in the ascending trend.
Protect yourself against the trading risks
using Risk Manager brought to you by Gerchik & Co!
Learn more about the service