How does one identify and trade price levels accurately?! This question has quite possibly popped up in the head of both the trader dealing with trading from levels and the majority of us.
Normally, the issues arise when you have already built support and resistance levels based on methodological materials available online, and now you are staring at this huge amount of lines, desperately trying to figure out what to do with them.
This article aims to provide answers to these and other questions related to strong levels. But first, let's see what support and resistance levels actually are or what they mean.
Strong level always equals a lot of money. Huge amount of money, to be precise! What you see on the chart in the form of stopped movement is the trace of this big money where you can draw risk limit, i.e. level.
Strong level always equals a lot of money. Huge amount of money, to be precise! What you see on the chart in the form of stopped movement is the trace of this big money where you can draw risk limit, i.e. level.
You need to find a spot where financial market players who manage large capital will defend their critical price. «What is this «critical price» you are talking about?» you may ask.
This is the price, reaching which the money will start losing its value which, in turn, means that the players will bleed red ink. As we are aware, it's not just «money», but rather «big money»!
If you know the place where the player's critical price is, you will know just the place where it will be easier for you to understand the risk. That way you can place stop-loss orders where the stop-loss of the player with large capital is most likely going to be.
Yes! Big players do lose money, too! What's more, that happens quite often to them! However, they do not hold on to their capital as much as we do. They treat it as just the business, and so the losses are nothing more than so-called «trading costs».
Understanding where this is more likely to happen will provide you with a major advantage in the form of the most reasonable entry point and clear insight into existing risk.
This price becomes a strong level where large capital will be trying to defend its stop-loss. Indeed, the bare fact that the player is ready to lose money does not necessarily mean that he wishes to do so. Just like us, big player came to the market to earn money, but, unfortunately, they do it using us.
To make money, he will - to the best of his great abilities - defend his critical price. Our task is to identify this point and trade from it accordingly in order to place our stop-loss order in the area where it is not profitable to let the price go for the big player, that is, to the area where he placed his stop-loss order.
What you have to understand are the following three principles:
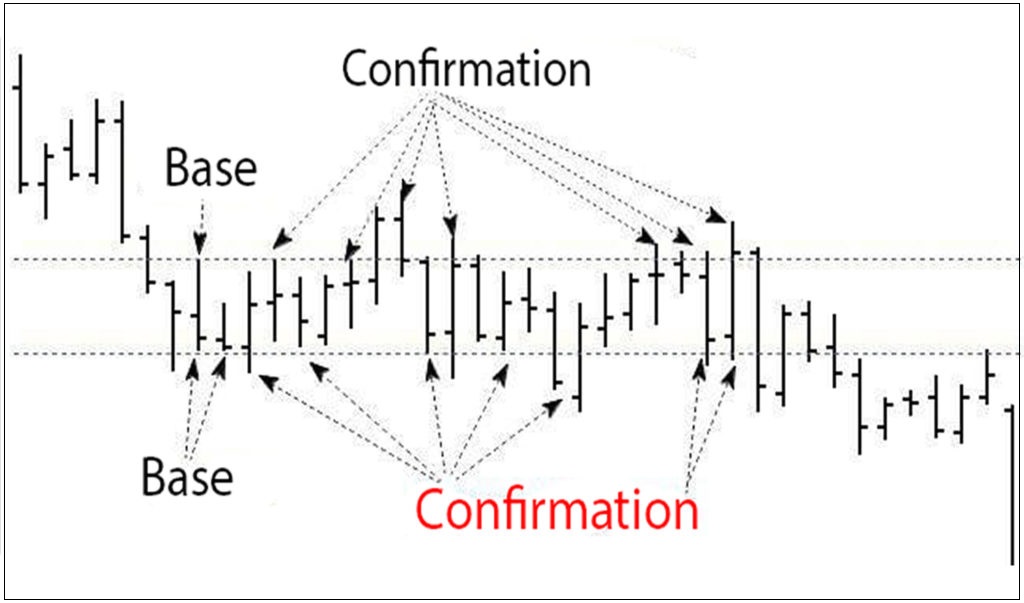
So, how can we identify the traces of the player defending the price (position) on the chart? In case like this, it is said that the level is confirmed. Let's take a look at the chart below.
In this case, it's the price touching support or resistance. Also, the levels are confirmed and strengthened by false breakouts, however, I will not explain their operating principle right now.
It is enough to know that they are used to take position, capture liquidity at the best price and manipulate smaller players.
In this article, we are going to start out from the price, regarding which the touching occurs, that is, where limit player positions himself, that way I will be able to explain the process of position taking a lot better.
Everyone who has ever taken interest in trading off levels knows that there are priority levels (all-time highs and lows), and there are the secondary levels, namely internal ones, i.e. those extremumes that are inside these priority extremumes.
Inside the priority levels, there may also be local extremumes which rise or drop, forming local trends.
«Why do extremumes move upwards?» you may wonder. The first thought that might strike your mind is that the price goes up or down, because someone needs this to happen. Then you may ask yourself whether these internal (intermediate) levels are the strong key points which we can link our risk to.
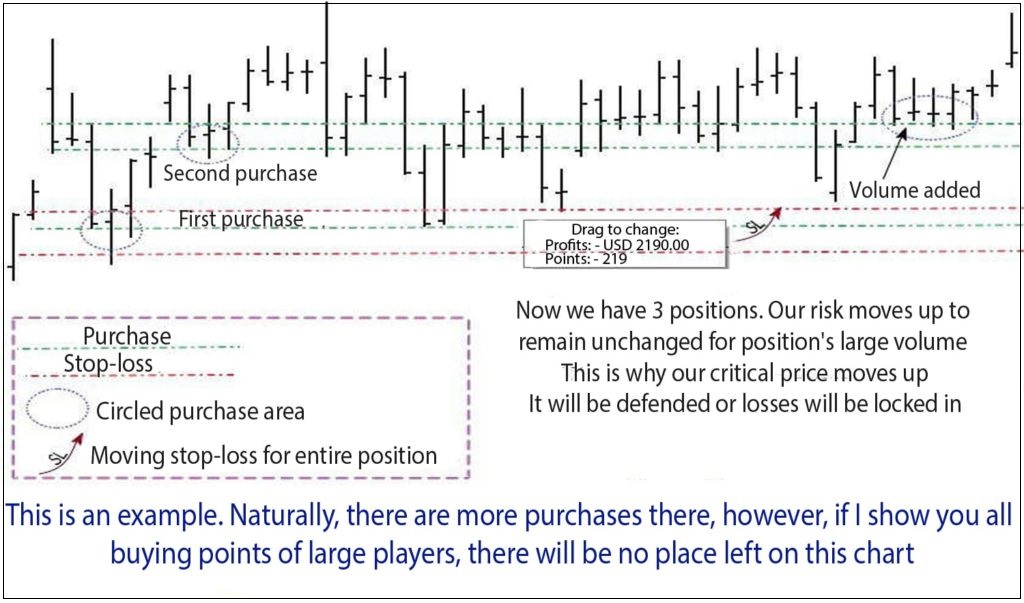
The point is that the player does not take just one position, but rather buys everything offered within a certain price range, meaning that the entire taken position will have an average price. In this case, this looks similar to the averaging principle. Let's examine this more closely.
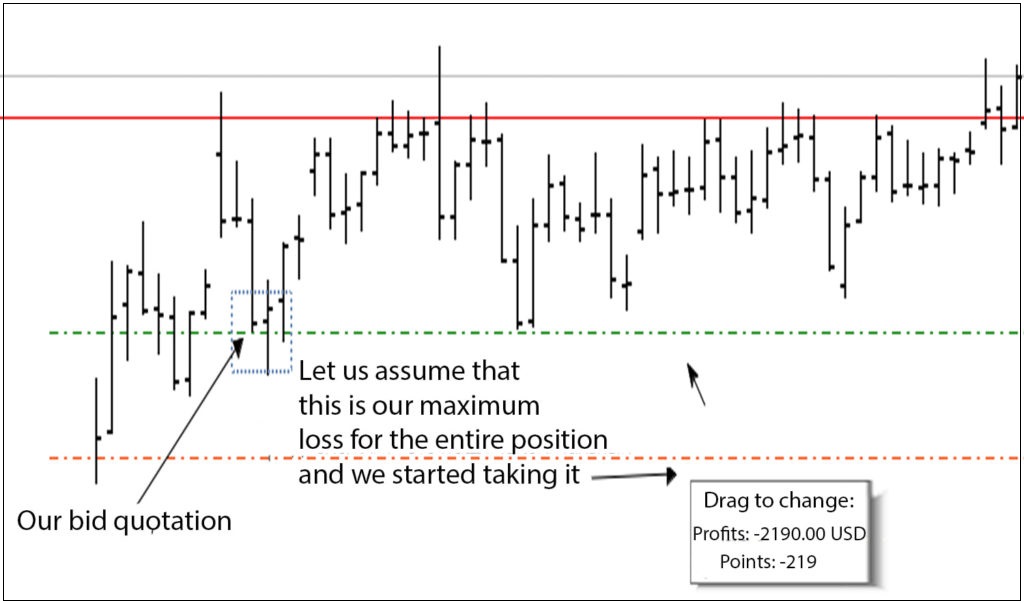
So, we are taking the position within the range, so our loss drifts, following the volume and the average price.
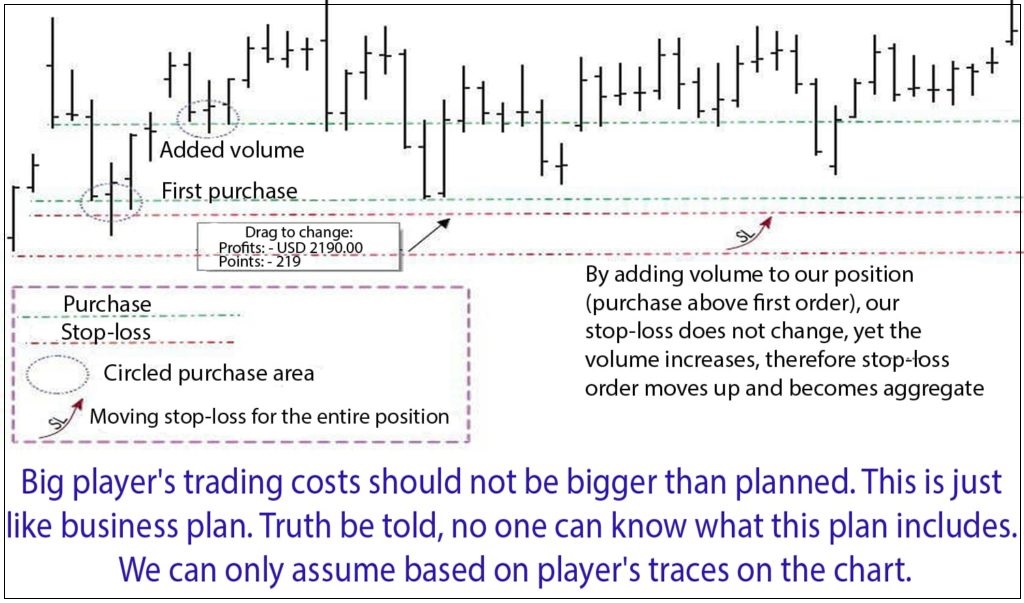
Big player's trading costs should not be bigger than planned. This is just like business plan. Truth be told, no one can know what this plan includes. We can only assume based on player's traces on the chart.
This means that when taking the position the critical price increases and the player is going to most likely defend the area which is closest thereto. However, we do not consider taking position by false breakouts which improve the average price for the position.
In any case, simple false breakout and even two-bar false breakouts do not reduce the average price all that much.
All of this is just a mechanism. It is not easy to tell for sure where the player's position is, without using volume analysis, and no one can predict how much the player is willing to risk.
How do we understand where the critical price is? This can be achieved in the same manner. We need a reaction, i.e. confirmation of the level.
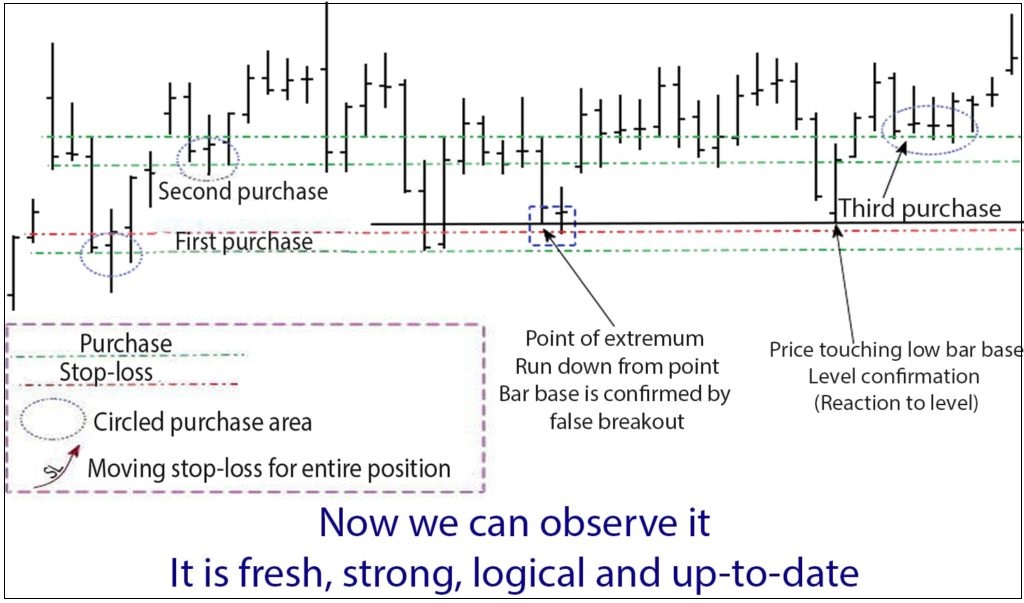
If there is a reaction to the level, such as stopped movement, touching, false breakouts, the level can be considered to be a strong one.
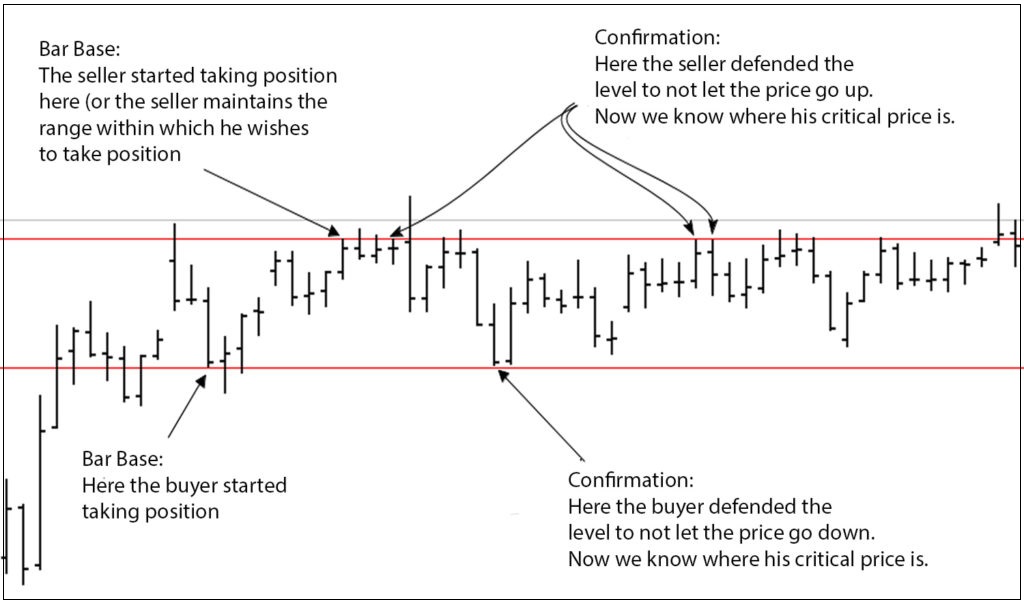
This is the daily chart where big players are taking positions. What you have to do is identify the player's trace, understand where his critical price is and where he defends it.
That way you will be able to trade from the level that this player is trading from, since this level is an important and easy-to-understand one.
Your transactions need to have an idea behind them, while being well-thought-out and having actual potential. When is the potential of the transaction higher? When the trading is done either according to the trend or at the time of loss locking-in by the big player.
The idea should be based on the following factors, namely:
Let's examine each of these in more details now.
The risk in Forex market is by far one of the most discussed matters. So, what is the understandable risk that everyone talks about every so often?
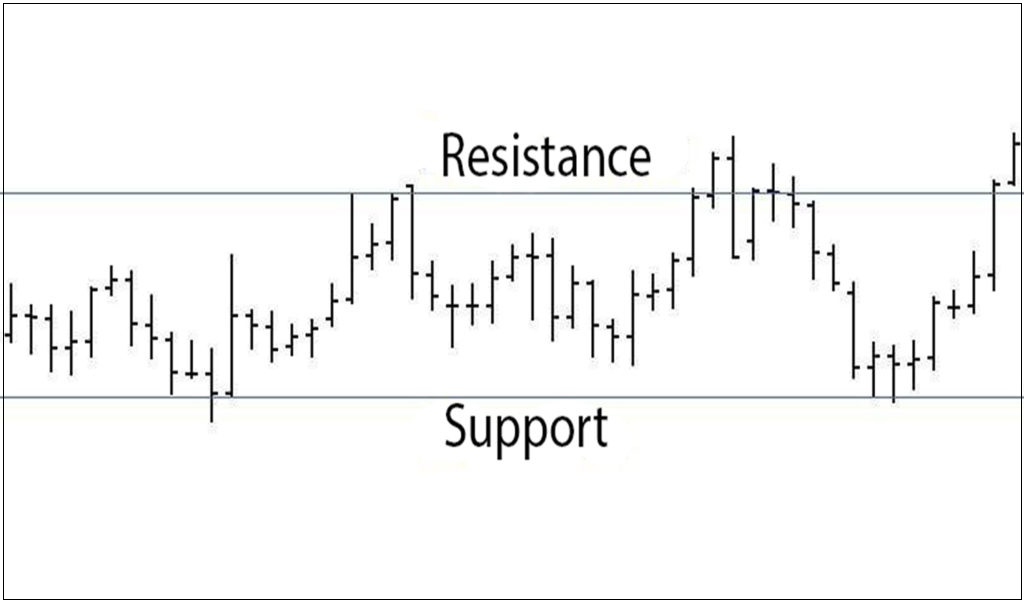
Before we actually proceed to discussing this matter, I would like to draw your attention to the expression «fair price». Fair price is the price accepted by the market players. Basically, it is some sort of accumulation (sideways trend) where the upper limit is expensive, and the lower one is cheap.
What do we do when it's expensive? We sell!
What do we do when it's cheap? We buy!
Of course, I am not implying that you have to buy when the market is going down. I'm talking about sideways trend or a range between two extremumes (levels), that is, a channel.
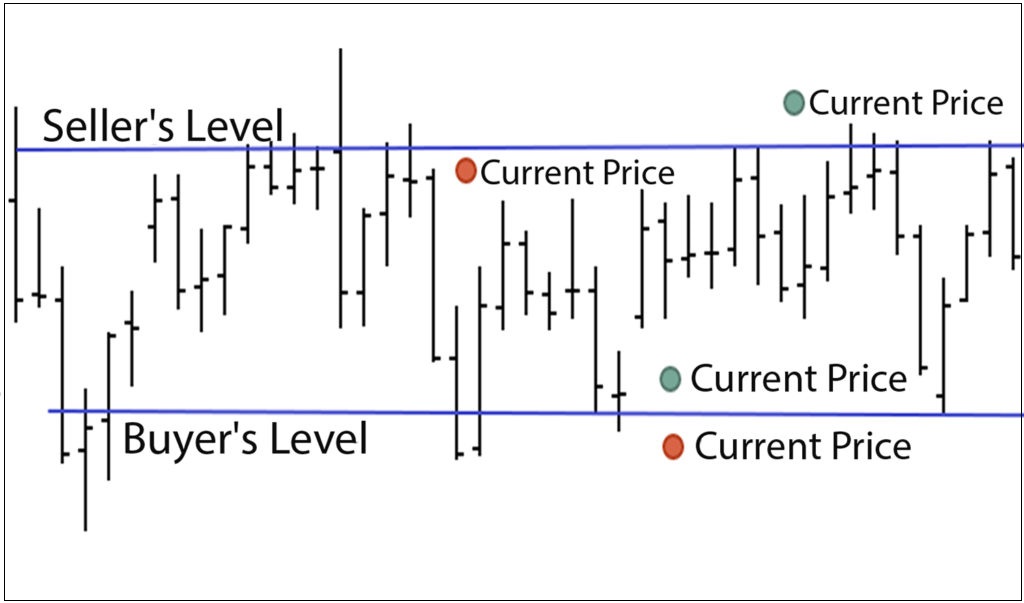
If the price is above the lower level, then we stand with the buyer. The idea is basically the following: if the buyer defends this level, he will also defend our stop-loss order, since it is not profitable for him to let the price go where he incurs losses.
Is the risk clear now? Yes, it is! Is it a minor risk? Yes, indeed! Is there a big likelihood that large capital would not wish to lose its money? For the third time, yes! If you got all three YESes, congrats, you may now proceed to the next round!
Enter the transaction. That's the idea I was just talking about. If the price is below the upper level, i.e. the level defended by the seller, we go short, if there is enough potential.
What is the trading's idea in terms of risk? Do we have the seller's defence? Is he willing to lose money? Is there a big likelihood that he will drive the price against himself? If you have got every answer to these questions, then this trading is associated with a reasonable risk, and you can open transaction.
If you ask yourself all these questions and evaluate the level and your entry point through the lens of relevant answers prior to each transaction, the likelihood of transaction's positive outcome is going to increase significantly.
You need to understand that trading in the middle of the range without seeing the critical price means risking to end up one on one with the market. If you are trading at the critical price level, you are not alone. «Big player» and his «big money» are with you and that's one solid support right there!
Why do we understand the risk, if confirmed level breaks out? Because when leaving the range, there has to be a strong movement and the buyer or seller will defend it from the opposite side, not letting the price return back into the range.
Because downward or upward price movement is just what he aimed at, and he needs to lock in the position.
In other words, in this particular case we have to change our ally. If someone managed to move the price which our big player was keeping, then he is definitely stronger than the latter. We need to stick to the stronger ones, so we change the banners and move forward, but only in the opposite direction!
Now let's get to the second factor of our transaction analysis, namely «Whom do we owe the price movement generated in the market?»
The market is basically driven by the initiative or so-called market orders, which also include stop-loss, a limit order that essentially becomes the market order as a result of its activation.
Now let's take a step back and see how the price behaves in case of level breakout. By the buyer's level breakout, the movement will be generated by stop-loss orders of the said buyer (sale of long positions) and market orders of the entered sellers.
The bigger the buyer's accumulated position, the stronger the movement at his stop-loss orders. When the seller's level is broken, the movement will be generated by the sellers' stop-loss orders (purchase of short positions) and market orders of the buyers.
The stronger the seller's level, the better the movement. This has to be taken into consideration when defining objectives. Let's take a look at the chart below that explains why we need to keep the price above the level by its breakout.
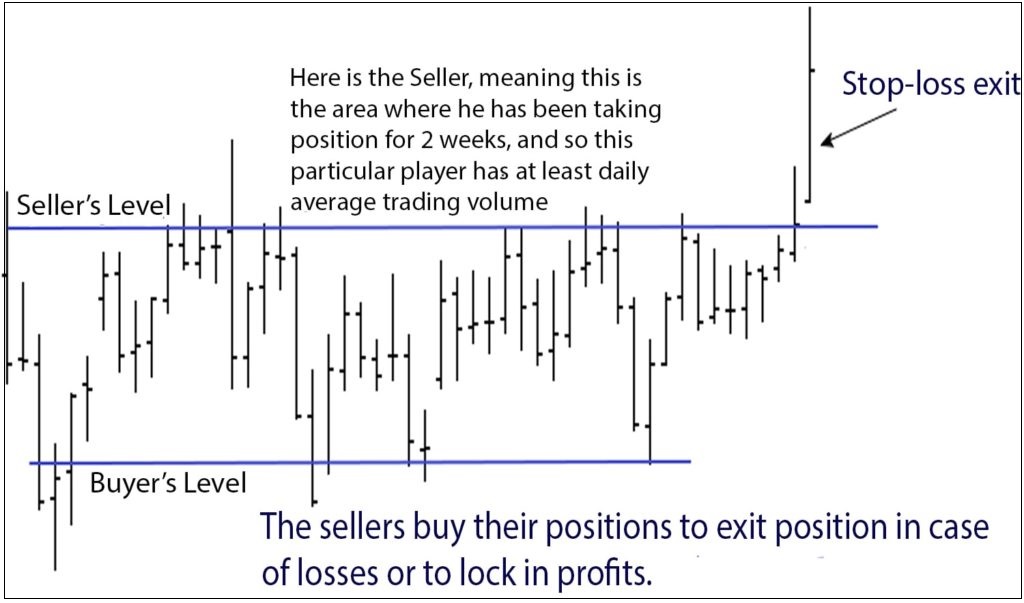
For starters, daily bar is the Average Daily Trading Volume (ADTV) absorbed by our buyer or seller. If the position is being taken for 2 weeks, what is going to happen if the player exits right after leaving the range? There shall be a massive impulse in which this player is going to lose.
This can be explained using the following example: let's say there is a seller who needs to buy his short position, locking in profit on sales immediately.
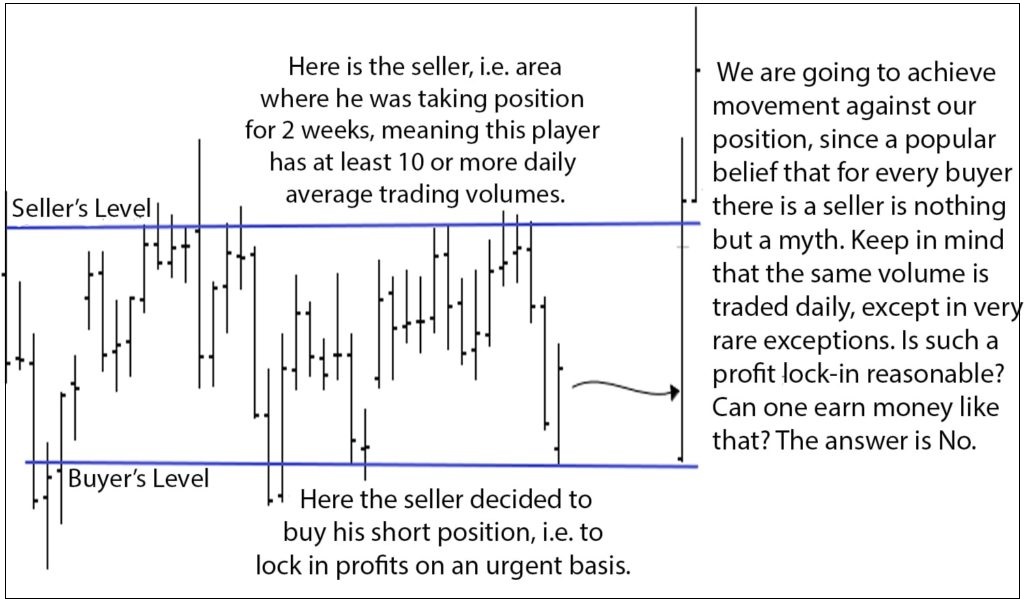
To gain profit at the average price of position taking, we need at least a smooth price drop. In a few days' time, the price should decrease so that the seller could lock in his position with profit.
Typically, by stop-loss exit the seller enters almost immediately (we do not take into account the price manipulation).
This means that impulse will be strong, generating the movement in the long position at the stop-loss of the seller who will compete with the buyer for entering the position at the desired price.
It is known as the market bid. The presence of two unidirectional players competing for the best price in the market, except one does that for the entry and the other one for the exit from the position.
This answers the question, «Who do we owe the price movement generated in the market?»
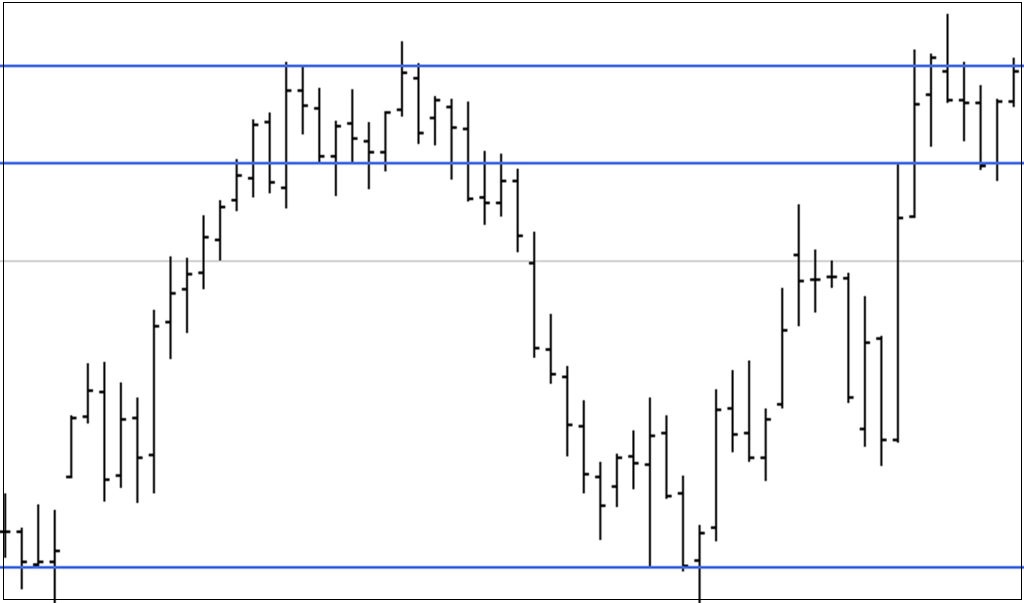
There is one last factor left that we need to get to the button of, namely «What is the potential of the price movement?» If there is no level nearby where a strong seller or buyer may be, you have enough range until the next strong level, you will lock in the profits on the long position at the next potential resistance level.
The stronger the movement by level breakout, the greater your potential for movement. We already know that the impulse occurs by breakout.
The impulse can come from 1 ATR (Average True Range) (primary) to 3 ATR of the tool. Let's take a closer look at the chart:
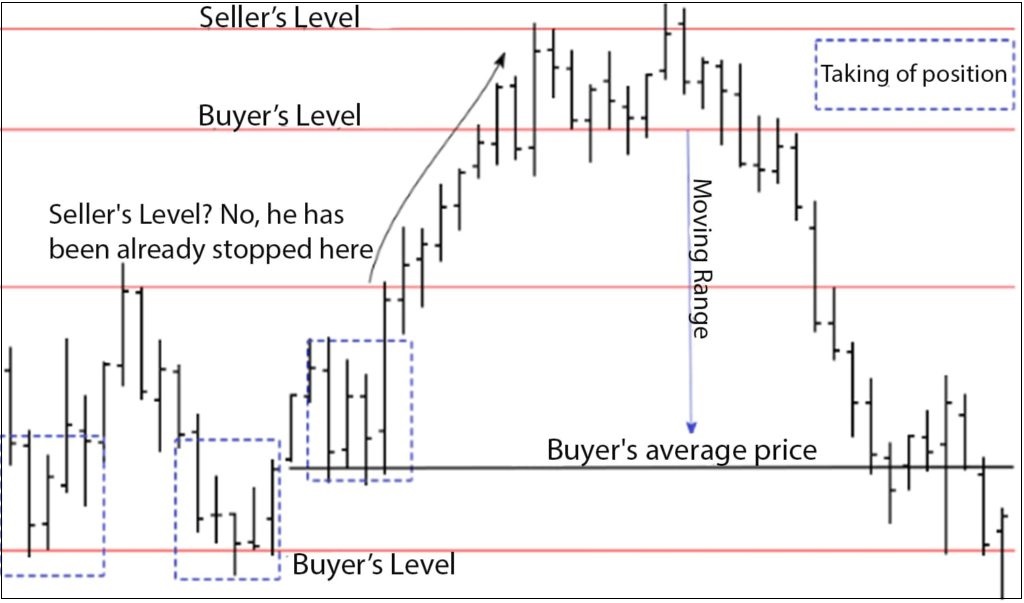
We already know who or what contributes to the price movement. Now let's try to find out who moves the price in this specific case. We move from the left to right. Double bottom. Two extremumes marked with rectangles from which the price moved upwards.
This is our buying area. In other words, the buyers, just like in the marked rising extremum, pushed the price by purchase flow. Where is the seller in this situation? The channel's limit, i.e. the point from which it went downwards.
By breakout of this extremum, the sellers exit positions, and we move upwards at the seller's stop-loss and purchases. What happens then is, the price movement stops and moves sideways, forming support and resistance level.
The range was maintained for a long time (11 days) and then it broke through the lower limit of the sideways trend. The seller came out on top. The buyer hoists the white flag and closes positions, whereas the seller jubilates and locks in his profitable positions at the buyer's stop-loss points.
In between, brand-new sellers join the movement and the market bidding begins with market players competing with each other for the best offer price. There we have it, an impulse. Level-based transaction planning.
Where is our understandable risk when entering into short positions? From the upper limit of the range on the test where the seller's critical price is; there he is going to lose money, and therefore he will defend it in order to prevent this from happening.
Please keep in mind that trading above that level has not happened for a long time, which increases the significance of the point, since the nearest resistance level is very far away and the seller when exiting the range will not know where else he will be helped in sustaining the price.
By downward level breakout, i.e. here not only pressure exerted by the seller, but also stop-loss orders of the buyer closing his positions can help generate movement.
Where are our potential levels of support for locking in profit? The level where the buyer, who can remain in the market (marked with a rectangle), was («Average Price» on the chart).
«Why him?» you may ask. There is also level's upper limit! The level can become mirror-like. I have an answer to this. Because the seller who was at this level will not defend his position, since it failed due to stop-loss order.
The only option left would be if the level was accepted by the market cheaply, or the buyer in this range (the first on the left) kept the price above the average for the position.
As you may see on the chart, the level (the buyer's average price), then it tested the basic level (the lowest purchases) and headed up. By the way, there was an understable risk when entering the purchases.
Strong level is the level which the player trades from and where his critical price is. The relevance of the level is shown by confirmation of this level close to the current price. Should the price bounce off the level, this means that the player is going to defend this level and therefore it is relevant.
Trading from relevant levels can help increase the number of successful transactions. Your risks in the Forex market will be more clear, and the potential of transactions will be greater, since movement from these levels is normally quite strong.
Now you are aware of the nuances which should be kept in mind when trading from levels. This way, you can make your trading more conscious and thus more efficient!