How profitable is black gold? Is crude oil production really the easiest way to cash on - just shove a pump into the ground where oil reserves are and reap the benefits? What happens to the countries that are dependent on crude materials and how much can crude oil crush stock indices?
Against the backdrop of yet another pressure on crude oil prices, what we are going to discuss today is the oil company ExxonMobile (XOM). Even though it falls short in terms of its S&P 500 index with only 0.96% as compared to other stocks, which we will talk about in upcoming articles, it still makes sense to take a closer look at the issuer's behavior given the decline in crude oil prices.
So, what is the anticipated net cost of the crude oil? The reason why we need to know this figure is to get an idea of OPEC’s pain threshold which induces its emergency response.
These are the data which are most frequently cited in publications:
Whenever the crude oil price plummets, we can hear the budget of countries dependent on energy commodity exports crack big time because this is when they need to tighten the belts. However, with the decline in the value of black gold, Russian oil companies are reluctant to shift away from their regular volumes, explaining this by the loss of the sales market’s portion.
When this is the case, everything is decided at OPEC+ meeting where the expected quotas are divided. The net cost by countries gives a clue as to why there was such a battle for Iraq, Libya and Venezuela, and why numerous barriers and conditions are created in order to keep Iran from globalization to this day.
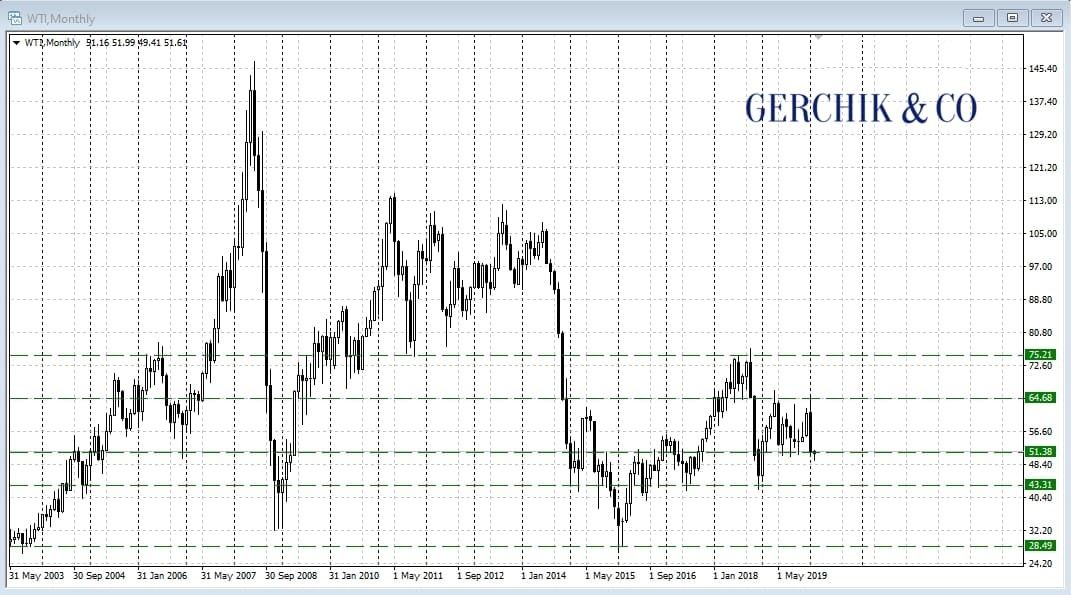
So, what do we have at the end of the day? Since the United States acts as one of the engines of the global economy and is unlikely to buy into the idea of emergence of big companies that are about to go bankrupt or suffer major losses, the crude oil will be trying to maintain its lower limit at about $30 per barrel. Otherwise, even American companies would feel uneasy right away. As far as the countries dependent on raw materials and sensitivity go, simply take a look at the RTS index and compare it with the S&P 500 index. During the period from 2014 to 2016, the crude oil price dropped from $107 to $27.70 per barrel. Prior to the 2008 crisis, quotes reached $140.
.jpg)
While the S&P 500 index has long left the 2008 levels, after the drop of 2008 and 2014 the Russian RTS Index went up only halfway by 2020.
.jpg)
Why is there such a difference?! Let's take a look at the share of issuers in the indices.
XOM accounts for 0.96%, while the energy group’s share in the S&P 500 index is 4.35% (of all energy companies). Simply compare the figures with the Russian RTS index, where 11.94% account for Lukoil PJSC only. In terms of percentage, Rosneft with 4.06% is like the entire energy sector in the S&P 500. Gazprom PJSC takes 15%, and then there are companies like Tatneft, Bashneft, Surgutneftegaz, etc. Even the first three giants we’ve mentioned already “bite off” more than 30% of the index. So, it makes total sense that the crude oil demand increases with the growth of the global economy.
From the way it looks, the demand for crude oil is secondary. And if we take the index which is mainly linked to raw materials, we simply miss out on diversification and move with the second echelon. All that’s left is a few speculative ideas when the market can be greatly underestimated, while the global background doesn’t seem to be struggling.
But let’s get back to ExxonMobile, which does not make a huge difference in the S&P 500, although it creates sectoral shake-ups. After all, the capitalization of $264 billion and over 70 thousand employees are quite a big deal, especially considering the importance of stable employment rates to the political elite.
The company is headquartered in Irving, a suburb on the west side of Dallas. The key crude oil reserves are located in Asia and the USA, with natural gas reserves being in the United States, Europe, Australia and Asia.
ExxonMobil was established in 1999 through the merger of the largest US companies Exxon and Mobile. Both companies are the "heirs” of Rockefeller’s Standard Oil company founded in 1870. The company managed to withstand many world calamities and cataclysms. Less than 20 years after the end of World War II, it generates record-setting profits, while strengthened relations with Saudi Arabia in the 1970s pay off generously. So, the voice of Saudi Arabia in OPEC is to some extent the voice of the United States.
Exxon and Mobile merged during the Asian financial crisis and a decline in black gold demand. In 1998, the price plummeted to $11 per barrel, setting an all-time anti-record. When did a Russian default hit, again?
Estimated reserves at the end of 2018 were 24.293 billion barrels of oil equivalent, with daily production being 1.648 million barrels.
The main chemical plants are located in the United States and Europe (Belgium, Great Britain, France, the Netherlands), as well as in China, Singapore, Thailand, and Saudi Arabia. The retail network includes 20.8 thousand gas stations in the US, Canada, Europe and in the Asia-Pacific region. The revenues are in the form of royalties for the use of Exxon and Mobil trademarks.
The company pays generous dividends of 5.80% (as compared to a 1.70% SPY ETF return). Over the past four years, the revenues went down from $364.76 billion to $279.2 billion. Net income is dropping from $32.52 billion to $20.84 billion as well. Earnings per share also declined from $7.59 to $4.88.
At the current price of $62 per share, P/E is around 12. In 2014, at a price of around $100, P/E was roughly the same, at around 13-14. Based on the latest quarterly earnings per share, about 60 cents per share is expected, with 75 cents being expected in April. With 60 cents of EPS per year, you can expect about $2.4 per share which is significantly lower figure than in previous years, and P/E at the current price of 25.
.jpg)
Following the drop in crude oil prices by 2015, the XOM price stops at the support level at 67.25. Later, as the situation with black gold stabilized, the company had a bit of a breather. However, that didn’t last too long and in 2018, due to the fears of a slowdown in global oil demand, ExxonMobile once again faces troubles. Price of 82 becomes resistance, and drop to 67.25 results in the level breakout. Now the price is moving towards fair value, to 2010 price levels at about 57.75.
.jpg)
It is evident that the stock remains weaker than the market, even though the price is already close to its fair value. Making hasty decisions in the market is typically a recipe for disaster. So, it makes sense to wait and see where the company will drop to minimum values and how long it will stay there in case of a more significant market correction. After all, 5.80% on dividend yield is an offer one can't refuse.
Author: Victor Makeev