The oscillator of moving average (OsMa) is essentially a combination of an oscillator and a moving average of that oscillator. It was designed based on data of another indicator, namely MACD. However, the difference between the histogram and MACD signal line is shown in a different way.
In today’s article, we shall explore peculiar features of the OSMA indicator and how to use its signals to enter the trade.
1. OSMA Indicator: What Is It and Where to Get It
2. Why Do Traders Need OSMA
3. How to Use OSMA Indicator to Enter the Market
4. Role of OSMA Indicator in Trading Tactics
You can find the OSMA indicator which belongs to standard oscillators in MetaTrader 4 or MetaTrader 5. Unlike MACD that is based on a similar principle, the OSMA indicator provides an earlier reversal signal which allows traders to ‘read off’ market changes.
OSMA is a forex indicator you can find by opening the “Insert” menu. Then proceed to indicators where you can choose “Oscillators” and Moving Average of Oscillator.
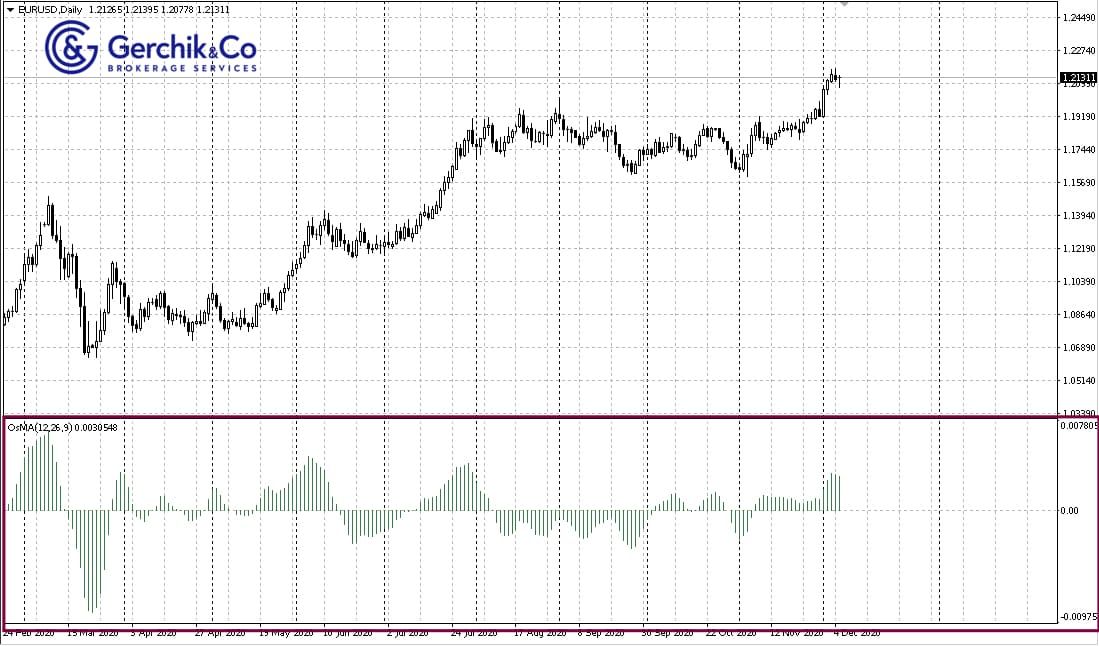
In the settings window, we shall leave the OSMA indicator settings as standard. The OSMA indicator will appear below the chart window which is a histogram that is above and below the zero level line.
.jpeg)
A lot of traders use regular MACD as an oscillator with their trading strategies. In contrast, the OSMA indicator shows highs and lows by one candlestick earlier, while the signals to enter a position in the overbought and oversold areas remain the same.
The OSMA signal gets accelerated since this oscillator is based on the method for measuring the difference between the MACD and the exponential Moving Average which acts as its signal line.
Therefore, the trader will get an earlier market reversal signal by using the OSMA indicator instead of the MACD. However, when performing comparison testing of these two oscillators, we were unable to identify objective advantages in terms of the number of positions closed in the black.
After reading the description of OSMA, you need to open the indicator under the chart window.
Below, we shall provide a step-by-step guide on how to read its signals and when to open trades.
1. A long position can be opened as soon as the candlestick, where the OSMA histogram moves through the zero level from the bottom upwards, closes. We use the market order to enter.
2. A short position should be opened at the current price as soon as the OSMA indicator crosses the zero line from top to bottom and is below it.
.jpeg)
It stands to mention that the OSMA is a divergence indicator. And so, along with the crossing of the zero value, we need to keep a close watch on the occurrence of convergence/divergence of the OSMA and the chart.
By spotting them in the chart, you can enter positions the same way as described above. The zero-level crossing signal remains relevant.
OsMA indicator is another handy oscillator. With that said, it is neither a cure-all solution nor a Holy Grail. It should be used as one of the tools that complement your trading strategy. OsMA reveals price reversal points; however, it’s important to use some other tools to filter off false signals. Otherwise, you may make unnecessary losing trades which is going to affect your overall profitability.
Here are some tips on how to build a profitable trading strategy with OSMA indicator:
1. You can ensure higher accuracy of your strategy when it’s based on several indicators.
2. Real Market Volume indicator allows you to recognize strong levels and price direction, as well as spot the traces left by big players and understand where strong support and resistance levels will be at.
3. Additionally, the OSMA indicator will provide local signals to open trades. Also, use standard settings on the daily timeframe.
4. Any other indicator you are familiar with and understand can serve as the third filter.
After articulating the market entry rules, make sure to test out your strategy with a tester or a demo account. Estimate the expected value. Don’t forget to clearly outline risk management parameters. And if all of this generates profit, you can safely proceed to apply the preferred strategy in a live account.
Login in Personal Account