ROA (Return on Assets) is a type of return on investment (ROI). It helps measure your business’s profitability with its total assets. ROA proves how efficient a company is by comparing a net income it generates with a capital being invested in its assets. This is how it works: the higher the return, the more efficient the management team uses its economic resources.
ROA helps measure return on total assets (equity plus liabilities). Alternatively, it shows how much profit a business generates with some funds invested by its shareholders and taking into account their total debt investments. Total assets are funded by both shareholders and debt holders.
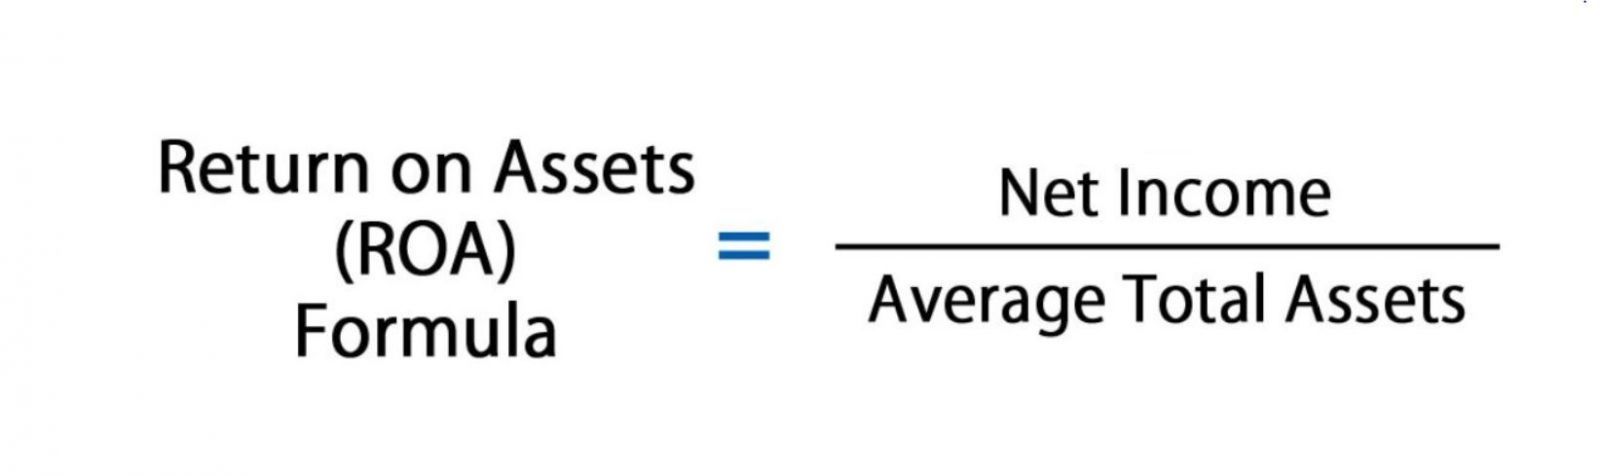
To get your ROA, you need to use the net income as the numerator and the average total assets as the denominator.
.jpg)
ROA = Net Income / Average Value of Assets
ROA = Net Income / Closing Assets
Net income is the difference between a company’s revenue and a total cost of doing business for the reporting period. It includes all taxes, interests, operating and non-operating expenses. The item “Net Profit/Loss” can be found in the profit and loss statement.
Average total assets can be measured as the opening and closing amount (in terms of a year) being halved. The initial and ultimate asset values are available on the balance sheet.
Co1’s profitability amounts to 3%. Every dollar of assets the company invests in brings $0.03 of net income per year.
Let’s calculate Facebook’s ROA for the quarter ended September 2020.
1. Net Income for the quarter ended September 2020. Net Income (Sep 2020) = Pre-Tax Income − Tax Provision + Net Income (Discontinued Operations) + Others = $8 133 − $287 + 0 + 0 = $7 846.
.jpg)
2. Let’s calculate the 12-month moving indicator. So, we need similar data for December 2019, March and June 2020. Net income for 12 months (TTM) for the period ended September 2020 is as follows:
$7 349 (Dec. 2019) + $4 902 (Mar. 2020) + $5 178 (Jun. 2020) + $7 846 (Sep. 2020) = $25 275m
.jpg)
3. Let’s now calculate the average value of assets. Total assets for the financial year ended December 2019:
Total Assets = Total Equity + Total Liabilities = 101 054 + 32 322 = 133 376
Total assets for the quarter ended December 2019:
Total Assets = Total Equity + Total Liabilities = 117 731 + 28 706 = 146 437
.jpg)
4. Let’s calculate Facebook’s annual ROA for the quarter ended September 2020. To that end, we need to take the asset data for the period ended June and September 2020:
ROA = Net Profit / Average Value of Assets = 25 275 / ((139 691 + 146 437) / 2) = 0.1767 = 17.67 %
5. ROA can be calculated/checked using the DuPont formula (asset turnover).

To that end, let’s take the 12-month moving revenue for the period ended September 2020:
Revenue = $21 082 (Dec. 2019) + $17 737 (Mar. 2020) + $18 687 (Jun. 2020) + $21 470 (Sep. 2020) = $78 976
ROA = Net Income / Total Assets = 25 275 / 143 064 = (Net Income / revenue) * (Revenue / Total Assets) = (25 275 / 78 976) * (25 275 / 143 064) = Net Margin % * Assets turnover = 32 % * 0,55203 = 17,67 %
6. Over time, we see ROA increasing, i.e., now every dollar of assets the company invests in brings $0.18 of net profit compared to $0.15 at the end of 2019.
.jpg)
7. Compared to peers, the primacy of Facebook’s ROA is obvious.
.jpg)
1. With ROA, we see the amount being earned per dollar of assets. Consequently, a higher return on assets proves that a business is more profitable.
2. ROA is an important indicator when we analyze a company’s profitability. It’s commonly used when comparing performance over various periods or when comparing two companies of the same size in the same industry. Keep in mind that it’s essential to consider the company’s size and operations when comparing two different businesses using ROA.
3. Note that return on assets shouldn’t be compared across industries. Capital-intensive industries that require high values of assets to operate tend to have lower ROA, as their larger asset base increases the denominator in the formula.
Obviously, a company with a large asset base can have some higher ROA if its income is high enough. For instance, retailers’ ROA is expected to be above 5%. Currently, Walmart’s ROA is about 8%. In case of banks, ROA is close to their interest spread and is traditionally well below 2%: 0.7% for BAC and 0.8% for JPM.
4. The higher your ROA (usually above 20%), the less resource-intensive your company is. ROA below 5% is considered to be a large asset business.
ROA helps measure a business’s average return on total capital sources. This enables us to assess how efficient the management team is if we talk about the rational use of assets in order to maximize profits.
⇐ Key to making money with shares. Lesson 8. P/FCF. Google Key to making money with shares. Lesson 10. (ROE) ⇒