Price to free cash flow (P/FCF) is a valuation metric used to analyze and compare a company’s per-share market price with its per-share price of free cash flow (FCF). This metric is pretty similar to P/CF.
However, P/FCF is more exact: it factors in free cash flow that subtracts capital expenditures from total operating cash flow, thus reflecting the actual cash flow a company has to fund non-asset-related items.
As the indicator is based on the cash flow statement (CFS), it’s seen as less prone to creative accounting.
FAST FACT:
In addition, free cash flow is similar to Warren Buffett’s concept of income that he uses to value companies (The Warren Buffett Way). It’s a strategy that combines Buffett’s focus on business value and quality. P/CF is used as the valuation criterion, while quality bases on operating profit and return on equity.
This metric is critical, as it shows whether excess revenue can be generated, which is seen as an essential parameter when it comes to share pricing.
Compared to income per se, free cash flow is more transparent, as it reveals a company’s potential. Some companies report high income but are unable to convert it into cash.
If a company can’t generate it internally, it’ll have to seek help from outside investors, which will either dilute shares or boost borrowing.
By definition, P/FCF offers two calculation methods:
Price to Free Cash Flow = (Market Cap) / (Free Cash Flow)
Price to Free Cash Flow per Share = Share Price / (Free Cash Flow / Number of Shares Outstanding)
Data on market cap/share price and a number of shares are available in stock exchange bulletins.
FAST FACT:
You can take free cash flow from the cash flow statement or calculate it on your own.
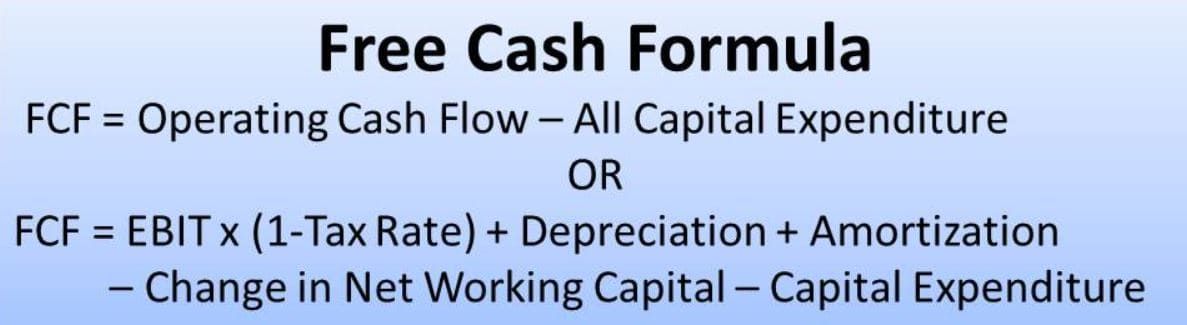
Free cash flow is operating cash flow after subtracting capital expenditures.
Earnings before Interest and Taxes* (1-Tax Rate) + Depreciation and Amortization – Change in Net Working Capital – Capital Expenditure.
(1).jpg)
In other words, FCF measures a company’s capability to generate what investors care about most: cash that can be distributed at their own discretion.
A company has 2 million shares outstanding:
1. Let’s calculate Google’s (Alphabet) Free Cash Flow for the quarter ended September 2020.
FCF 3q = CFO − Capital Expenditures = $17,003−$5,406 = $11,597
FCF per Share 3q = (CFO − Capital Expenditures) / Shares Outstanding (Diluted Average) = ($17,003 − $5,406) / 731.959 = 15.844
(1).jpg)
(1).jpg)
2. Now let’s calculate the trailing indicator for 12 months. To that end, we also need data for December 2019, March, and June 2020 (similar to our September calculation).
12-month Free Cash Flow (TTM) for the period ended in September 2020 is as follows:
$8.375 (Dec. 2019) + $5.446 (Mar. 2020) + $8.602 (Jun. 2020) + $11.597 (Sep. 2020) = $34.02
12-month Free Cash Flow per Share (TTM) for the period ended September 2020 is as follows:
$12.159 (Dec. 2019) + $7.373 (Mar. 2020) + $11.729 (Jun. 2020) + $15.844 (Sep. 2020) = $47.11
3. At this stage, let’s find out P/FCF according to both formulas (the share price as of November 12, 2020 is $1,747.23).
(1).jpg)
Price-to-Free-Cash-Flow per share = Share Price / Free Cash Flow per share (TTM) = 1,747.23 / 47.11 = 37.09
Price-to-Free-Cash-Flow = Market Cap / Free Cash = 1,184.01 / 34.02 = 34.80
(1).jpg)
4. Compared to last year, Google’s P/FCF was better in September 2019: 19.75 (lower share price and higher FCF).
(1).jpg)
5. Let’s take a look at the peers:
Google currently has a decent P/FCF in comparison with its peers.
1. Some investors will choose companies with significant free cash flow thanks to the promising future. Combined with a low share price, they can make decent investments in companies with high free cash flow.
2. There are investors who pay more attention to free cash flow compared to other metrics.
3. However, as with evaluating any multiple, it’s always necessary to do a comparative analog and historical analysis to make an informed decision.
⇐ Key to making money with shares. Lesson 7. P/CF Ratio. Facebook Key to making money with shares. How to pick stocks ⇒