As a part of our first lesson, we discussed what factors must be taken into consideration when choosing assets to invest in or trade. We have explored the concept of diversification, corporate leadership, and portfolio. In Lesson 2, we are going to tackle actual ratios, namely the price-to-earnings (P/E) ratio.
1. P/E ratio: Definition
2. P/E: Calculation formula
3. Here’s where you can find the P/E earnings multiplier
4. Let’s sum things up
The P/E ratio is one of the fundamental indicators you should pay close attention to when investing. This figure shows whether the company’s share is overvalued or undervalued.
P/E is a relationship between the current price of the company’s share and annual earnings per share. In essence, price-to-earnings points to an amount expressed in dollars and measures how much the investor intends to pay for $1 of profit. This is why P/E is sometimes referred to as a price multiplier.
For instance, if the company is traded with P/E amounting to 10, this should mean that the investor is ready to pay $10 for $1 of the current profit.
Typically, a 14-20 ratio is considered accurate for the majority of stocks. A lower ratio may indicate that the company is experiencing problems, whereas a higher ratio may point to an overvalued stock.
P/E Inverse Value = Earnings in % = E/P = 1/(P/E)
There are two ways to calculate P/E. The first one uses the relationship between price and earnings per share.
Р/Е = Market Price per Share/Earnings per Share
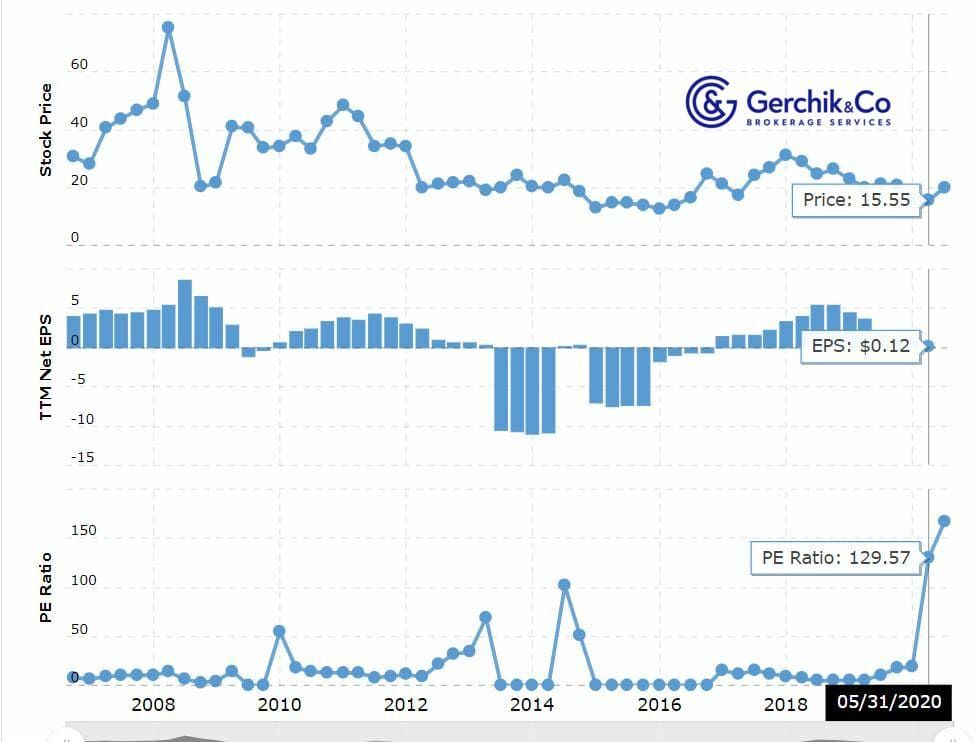
Let’s consider the example of companies belonging to the same sector: Schnitzer Steel Industries (SCHN) and Nucor Corp (NUE).
(1).jpg)
This is the simplest, classical approach since all information is publicly available. You can see the stock price in the quotes on any exchange while information on the company’s earnings can be obtained from the financial statements.
P/E SCHN = 15.55/0.12 = 129.57
P/E NUE = 41.41/1.68 = 24.65
Given the industry-average Р/Е which is 26.40, the SCHN ratio can mean that the share value is too high against earnings i.e. it is overvalued. NUE corresponds to the fair value.
(1).jpg)
The second approach implies the usage of the relationship between the company’s market capitalization and earnings for the reporting period (typically per annum).
P/E = Market Cap / Earnings
This calculation method has its nuances. The resulting figures may not be the same; however, the error limit will not be significant. The key purpose of this multiplier is to measure whether it is higher or lower than the comparative industry data.
Let’s take a look at a real-case scenario. According to the financial statements of Schnitzer Steel (SCHN) as of August 31, 2019:
P/E = Market Cap / Earnings = 620 000/56 345 = 11
And now here’s a calculation done using the first approach as of the same date:
Р/Е = Market Price / Earnings per Share = 21.24/2 = 10.62
As we can see, the error limit is minimal.
(1).jpg)
(1).jpg)
P/E is currently available on special websites depending on the selection criteria:
Share value and earnings affect P/E. At the same time, Р/Е has a number of special features which must be taken into consideration:
To see the bigger picture and understand whether it makes sense to buy shares of a particular company, you have to analyze many different factors and multipliers. And that is exactly what we will continue doing in our next lesson.
Open an account with Gerchik & Co and start making money with shares now
⇐ Key to making money with shares. Lesson 1. How to pick stocks Key to making money with shares. Lesson 3. P/B Ratio ⇒