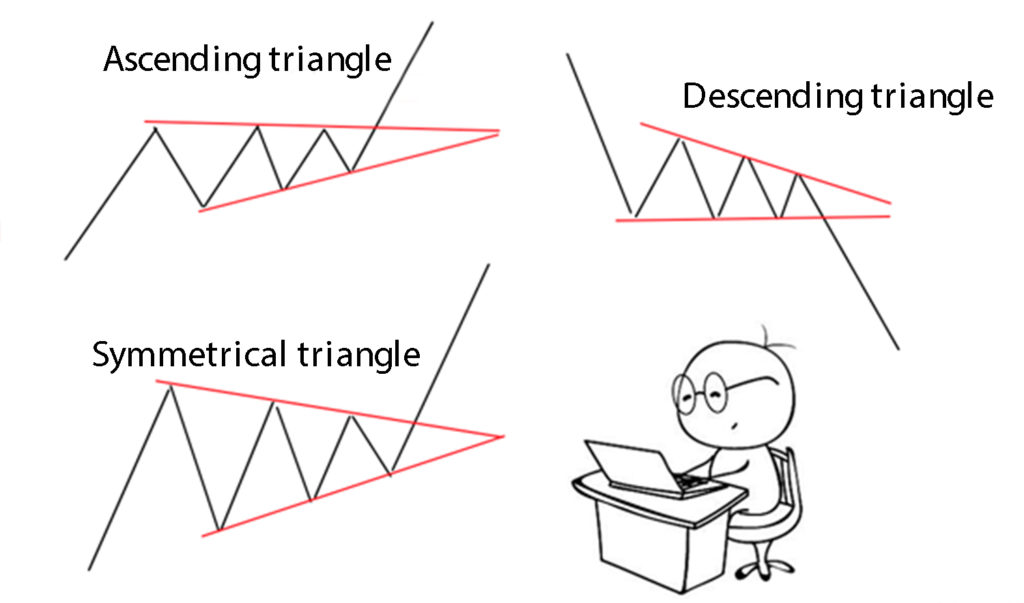
- Ascending
- Descending
- Symmetrical
Today's article focuses on the triangle chart pattern in the Forex market.
You will find out how it is formed on the chart, what are the rules for its determination, what this pattern indicates and which steps the trader should take in order to benefit from this situation.
Triangle pattern points to a price movement continuation on the chart. Depending on the previous trend direction and the way it is formed, the triangle can be either bullish or bearish.
There are three types of triangles, namely:
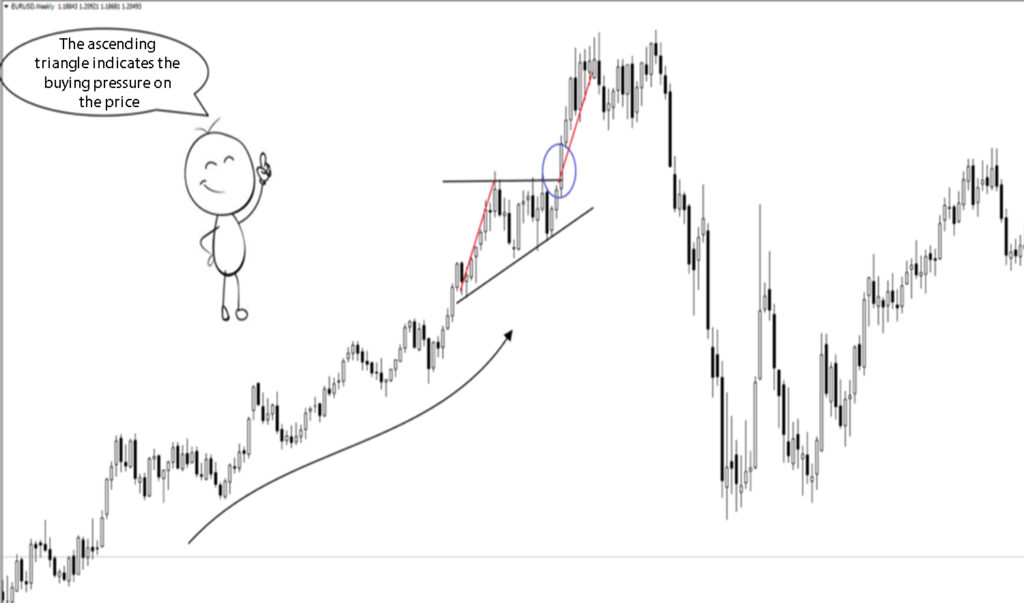
Prior to the formation of the ascending triangle on the chart, there is a bullish price movement. The triangle is deemed to be accurate when the price bounced off the resistance level at least twice in the course of its formation.
We can draw a horizontal line on these price highs. It must be noted that the price does not necessarily touch this line; however, it should approach it close enough.
By the technical analysis of the ascending triangle, its bottom line is built along the local lows which follow after the price rollbacks from the resistance level.
This line shall go through at least two local lows located at some distance from each other.
If at least one of the subsequent lows is located below the preceding low, this ascending triangle formation is deemed invalid.
In view of this, we can conclude that when the ascending triangle is formed in the technical analysis, the prices go higher and higher, whereas the highs remain on the same level.
It should also be noted that the ascending triangle can sometimes appear at the end of a downtrend, evidencing its completion.
When all of the conditions for the ascending triangle formation are met, we wait to see how the things unfold next and expect the breakout of the top line of the pattern.
When this level is broken out, we have to wait for the candle to close above the boundaries of the triangle.
If this happens, you can go long, placing the stop loss order slightly below the last local low reached by the price when the triangle is being formed.
The movement potential is determined by measuring the distance from the lowest point of the triangle to its high.
The way the descending (inverse) triangle is built is precisely the opposite of the ascending triangle construction approach.
The lower horizontal line is drawn along the lows of the price movement which are located approximately on the same level. There shall be no less than two lows.
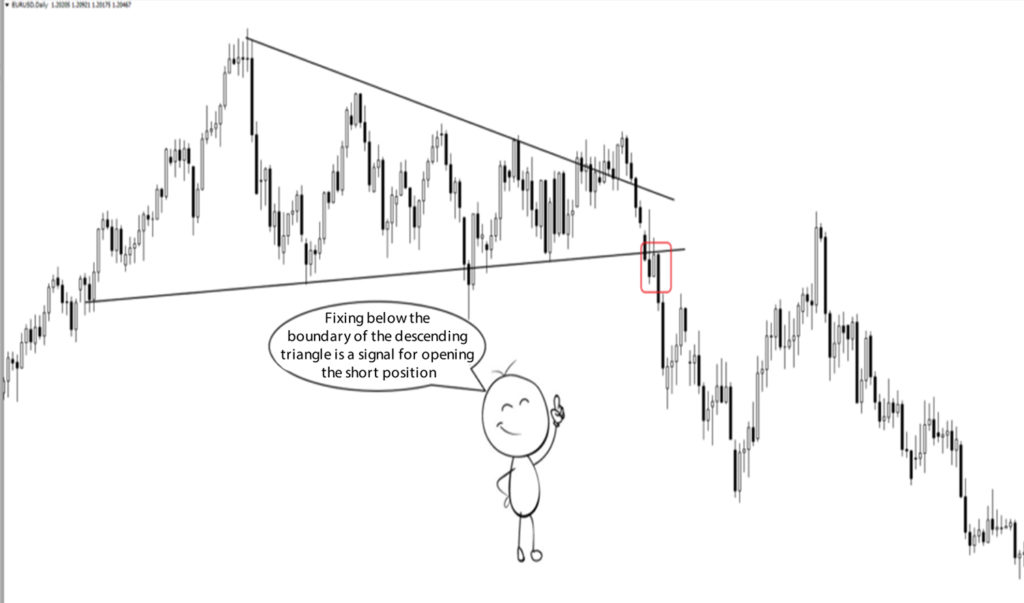
The top line in descending (inverse) triangle pattern shall go through at least two local highs, and each subsequent high has to be lower than the previous one.
These highs must be located at a certain distance from each other. If at least one of the subsequent highs is at the same level as the previous one, the triangle is believed to be inaccurately formed.
In some instances, the descending triangle may serve as an uptrend reversal signal.
The inverse triangle is traded based on the same principle as the previous bullish pattern. When the horizontal line of the triangle is broken out, we wait until the price fixes below the support level.
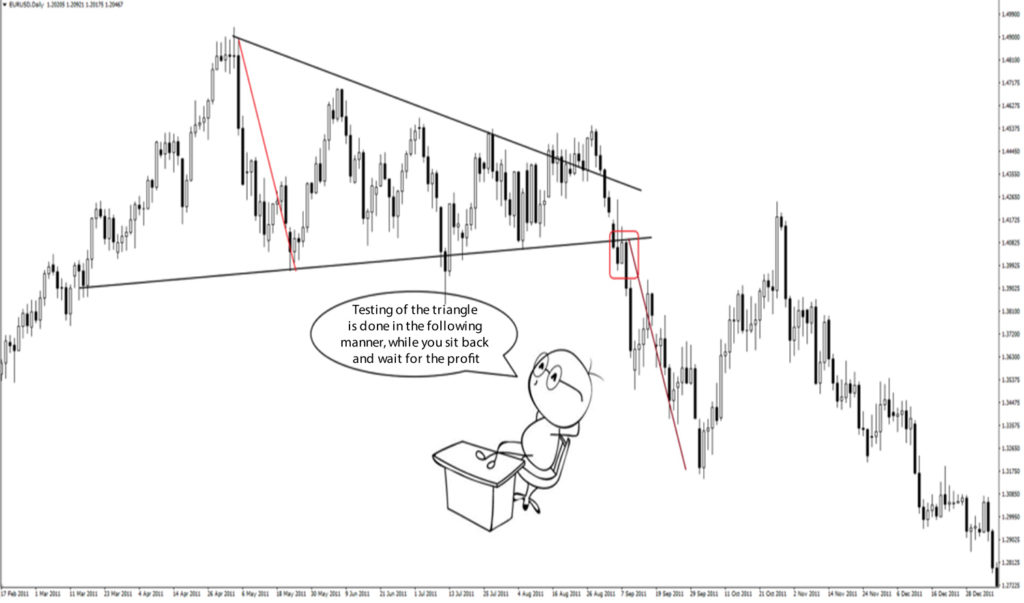
After that, we place the stop loss order and wait for the price to drop to the gap equal to the distance from the highest point of the ascending triangle to its low.
When approaching this level, we can lock in the portion of our profit and wait for further price decline.
The symmetrical triangle contrasts with the examples of the ascending and descending triangles which we have reviewed. Its key feature is that before one of its sides is broken out, we cannot tell for sure in which direction the trade should be opened.
This is explained by the fact that the symmetrical triangle in the Forex can be both a reversal and a continuation pattern.
This triangle is determined on the chart with help of slanting lines drawn along the highs and lows of the movement which is tending toward the center.
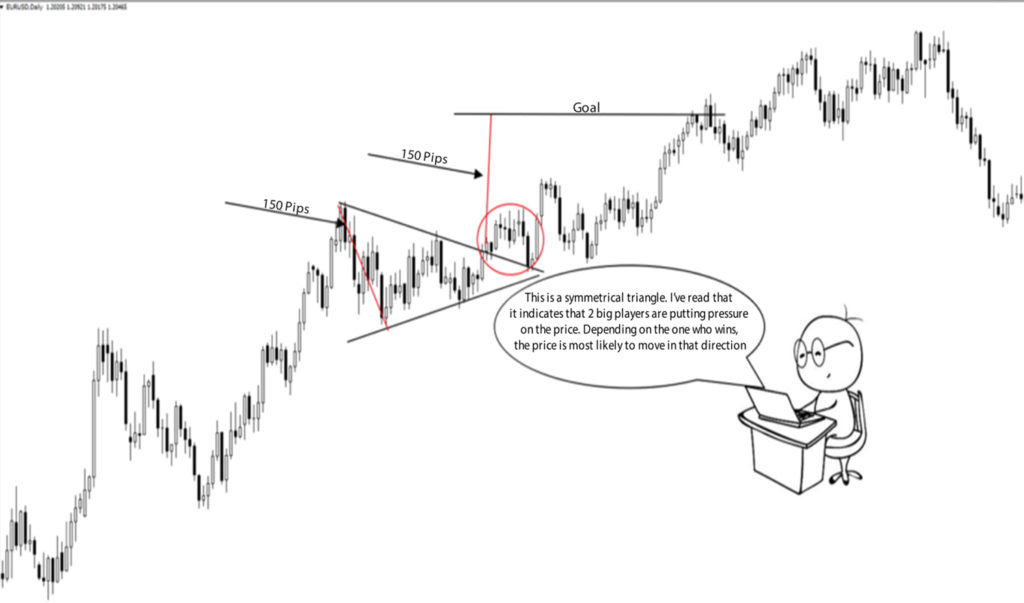
In order for the symmetrical triangle to be deemed accurate, the slanting lines should go through at least two local highs and two local lows. The top line should be facing downwards, whereas the bottom line should be facing upwards.
In order to determine, in which direction the trade can be opened, you have to wait for the price to exit the triangle and the piercing candle to close above or below the upper, or lower slanting line.
Once this happens, you have to place the stop loss order on the opposite side of the triangle. Just like in the previous triangles, by measuring the widest portion of the triangle you can determine the trend potential.
The signal is believed to be more accurate, if one of the triangle lines is broken out and this breakout takes place, when the price has passed less than 2/3 of the triangle’s distance.
The breakout of one of the lines in the last third of the triangle is deemed to be less reliable, since more often than not the price returns back inside the boundaries of the pattern.
In this article, we have examined three types of triangle chart patterns, methods for building them on the chart, how to identify the price movement direction, when the triangle was formed and how to correctly open the trades in order to gain from these signals.
Login in Personal Account