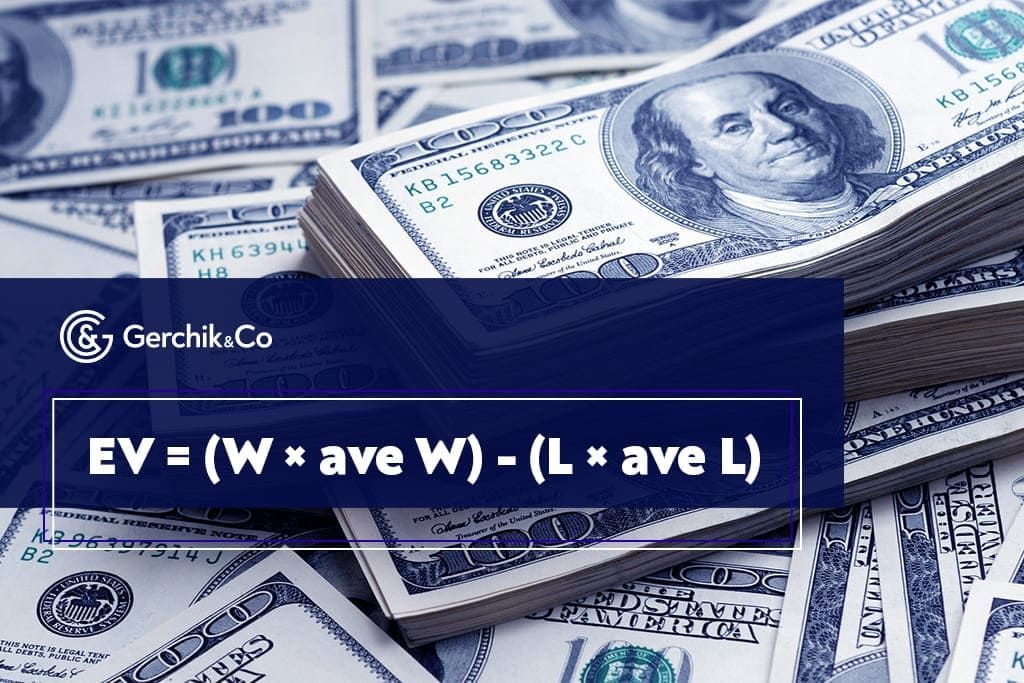
In previous articles, we have examined the special features of short and long positions. Knowing when to go short or long is an essential precondition for a successful trading outcome. That being said, it is possible to achieve consistent and anticipated revenue in financial markets by knowing what the expected value is.
In today’s article, we are going to get to the bottom of this concept, explain how to calculate the expected value, and implement it as part of your trading strategy.
1. So, What Is the Expected Value
2. How to Calculate the Expected Value of the Trading Strategy
3. Positive Expected Value, Trading, and Risk Management
4. How to Profit from the Expected Value
Profitable trading and expected value are the two concepts that go hand in hand. The Expected Value, or EV, is a vital element of any profitable trading strategy. The trader can find out how profitable a particular strategy is by calculating the EV. To this end, we use the following formula:
EV = (W × ave W) − (L × ave L) where:
.jpg)
A positive expected value in trading means that the chosen trading strategy is able to generate profits in the medium-term and long-term perspective provided that the trader strictly follows its terms.
To learn what the expected value of the trading strategy is, simply use the formula described above. But first, you need to collect the following data needed for its calculation. These are namely:
First things first, you need to test out the strategy. To do so, you can use a demo account. Make sure to open positions using every signal you get and stick to the rules. To build insightful statistics, you need around 100–200 trades. You can also use the strategy tester and collect statistics from historical data.
As soon as the relevant data are obtained, you can proceed to calculation.
When it comes to the aforementioned formula, there’s one important correlation—the higher the reward/risk ratio per trade, the higher the expected value. Let’s take a look at the example illustrating this. Here are the input data to be used for the calculation:
By putting these figures into the formula, we shall get the following result:
EV = (W × ave W) − (L × ave L) where: EV = (50% × 4%) − (50% × 1%) = 150%
In the given scenario, the positive expected value is 150%. What does this figure mean? Let’s express the above formula in monetary terms using the parameters listed below:
And this is the result we are going to get:
EV = (0.50 × $400) − (0.50 × $100) = $15 000
This means that the size of the average profit for each trade will be $150.
It would be logical to assume that the expected value in trading will change for the worse when the reward/risk ratio decreases. In the case of a classical 1:3 stop loss/take profit ratio, we shall get:
EV= (0.50 × $300) − (0.50 × $100) = $10 000
If this ratio is 1:1, EV will be zero. And that makes all the sense. Risking one dollar to make one dollar is just like standing still and doing nothing.
Everything may seem simple. However, when the traders enter the market, psychology, which is a powerful force, comes into play. That’s when they forget about all the calculations and everything else as the thrill or greed takes over. This is why the traders who use the automated risk management software are protected against the emotionally-driven trades as compared to those who fall victim to their emotions by trading without any risk management programs.
As you can see, the formula is not that complex. If you automate this process by using an Excel file, for instance, you will be able to calculate the expected value for the strategies you wish to test out.
Alexander Gerchik oftentimes shares how he used to rip real dollar bills in order to teach himself that thoughtless trading and violation of risk management rules come at a price.
If your broker has a risk management solution like Risk Manager offered by Gerchik & Co, be sure to use it to keep both stress and possible losses to a minimum.
In our next article, we will talk about how to factor in everything when opening orders.