Let’s keep exploring some important share value ratios. Today we’re going to analyze a new indicator using the example of the extremely popular company—Tesla.
Investors are always searching for some ways to analyze the value. To that end, we often use the P/S (price-to-sales ratio). To find out whether the shares are valued correctly, you need to compare the market cap and the company’s revenue.
This ratio is widely used, as it shows the company’s value in the context of one of the easiest financial metrics—its revenue.
The P/S was developed by Kenneth L. Fisher, a share market expert. Mr. Fischer noted that investors were unrealistic about a company when it was going through an early growth period. When the value drops below their expectations, investors hit the panic button and sell their shares.
Mr. Fischer believed that a company with a strong management team should be able to spot the problems, solve them and move on. If it can rectify the situation, the share price and profits will rise.
To help fix the overvaluation problem, Mr. Fisher came up with the P/S. The value of sales is used as the base for the formula, since sales don’t fluctuate when revenues do so.
The price-to-sales ratio can be determined in terms of the company’s market cap or on a per-share basis.
P/S = Current Market Share Price / Annual Sales per Share
P/S = Market Cap / Annual Revenue Past 12
Total sales are the top line of the company’s profit and loss statement.
MonthsMarket Cap = Number of Shares * Market Price.
The sales and total outstanding shares can be found in the publicly available sources that we mentioned during the previous lessons, in the profit and loss statement or in the notes.
The sales figure in the formula can refer to any of the following timeframes:
The P/S is also referred to as the PSR (Sales multiple/Revenue multiple).
The P/S calculated on the basis of the forecast sales is called the forward price-to-sales ratio.
The price-to-sales ratio is one of the easiest ways to understand a company’s value. It helps investors find out how much they’re actually paying for their assets.
Any business focuses on generating revenue from the sale of goods/services, while the P/S provides the value based on a company’s performance without any accounting adjustments.
The P/S also helps new companies or startups with zero net income value their assets. The low P/S is seen as optimal, as it shows that a company is undervalued, but nevertheless, this ratio needs to be analyzed from a historical and industry perspective as well.
You should see an investment opportunity as a whole, which can help spot an underlying problem that can’t be found by taking a look at the results of each formula.
As with most financial metrics, the P/S can change every day, so it’s important that the indicator has a temporary mark. The P/S is an expected indicator, not an actual one. It’s used to understand the true situation and compare with the other companies’ condition in the same industry.
For example, some company XYZ is quoted at the current price of USD 5 per share. There are 200 million outstanding shares. Its annual revenue amounts to USD 400 million. The current P/S values can be calculated using any of the following methods:
Per share: Share Price / (Annual Sales / Outstanding Shares) = (5 / (400/200) = 2.5.
Market Cap: (Share Price * Outstanding Shares) / Annual Sales = (5 * 200) / 400 = 2.5.
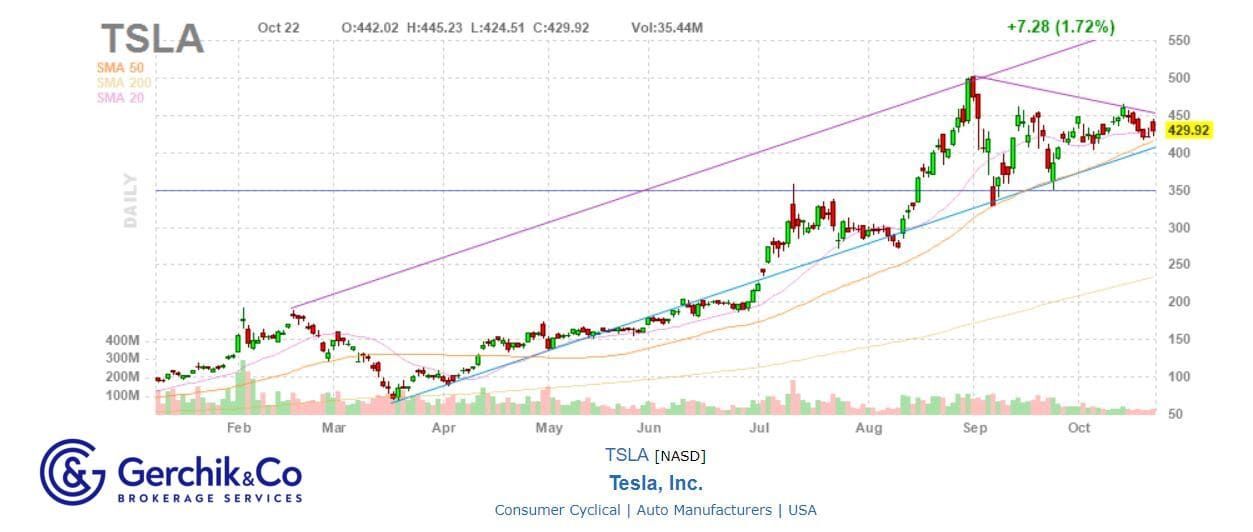
Let’s take a closer look at the example of such an exceptional company—Tesla. By the way, Gerchik & Co offers stock CFDs.
As you know, Tesla submitted its quarterly report on October 21. The shares are currently quoted at USD 429.92.
.jpg)
Price-to-Sales (1) = Share Price / Total Sales per Share = Price per Share / (Revenue / Share) = 429.92 / (25.71 / 0.93) = 15.55.
Price-to-Sales = Market Cap / Total Revenue Past 12 Months = 402.07 / 25.71 = 15.64.
.jpg)
.jpg)
During the analyzed period, the share price increased by 215% (from USD 68.59 to USD 215.96). At the same time, the sales increased by 66%. Consequently, the company has become more expensive in terms of the P/S in three years. In other words, as of June 30, 2020, its investors paid more for its investments in comparison with the level of sales than 3 years ago.
During the first year, investors were willing to pay USD 4.22 for every dollar of sales per share. During the third year, it was USD 7.99. There can be many reasons in this case, e.g., the company’s leadership in the industry, speculation, etc.
This suggests that Tesla is more expensive than its peers on the stock exchange. And investors are willing to pay a higher price for its shares.
NOTE:
Keep in mind that a very high P/S can be a warning sign.
The P/S shows how any company is efficient in generating revenue, taking into account its outstanding debt. Keep in mind that it’s most useful when compared to the businesses in the same sector. Without the right context, the statistics can appear abstract and become irrelevant.
The P/S ratio is based on publicly available data. The share price, the number of issued securities and the overall revenue data are publicly known and aren’t purposefully released by a corporation to the market. In comparison, the price-to-earnings ratio (the P/E) depends on what accounting methods a company uses to determine the bottom line’s divisor. Generally, the P/S isn’t easy to handle due to the statistics used in each calculation.
The P/S is often used when valuing cyclical companies or those that aren’t currently profitable. As long as a company doesn’t face bankruptcy problems directly, there is a chance to make a profit in the future.
For example, in case of a retailer, its revenue often has a seasonal nature; a company may periodically incur losses while its long-term profitability remains unchanged.
1. The price-to-earnings ratio has its limitations. For example, the P/S varies across many industries, and it’s incorrect to compare companies from different sectors. Moreover, this multiple can’t distinguish an organization that uses borrowed funds from one that goes without them. The reason is that a company may report a low P/S and be close to bankruptcy.
2. How can the investor tell the difference? In this case, it isn’t the capitalization that should be used in the calculation but a company’s value (adding the long-term debt to the market cap and deducting any cash). This type of approach eliminates the hassle of comparing polarized companies—those that rely on debt to increase sales versus those that don’t have debt with lower sales.
3. In addition, the P/S doesn’t give any information about profitability or costs, so it’s important for investors to consider this ratio along with other financial indicators.
While the P/S is seen as the key industry metric for investment scrutiny, its detractors state that it’s of limited relevance when determining a company’s intrinsic value. According to the efficient market hypothesis, all important information about a company’s value is built into its current share price.
All in all, using the share price as an input to calculate the P/S ratio is counterintuitive, thus making this multiple largely irrelevant. Conversely, many analysts and investors believe that a company’s share price is based on public perception. For such parties, a chance to invest in some undervalued company is a potential way of appropriating financial gains.
In pursuit of the trades in the share market, the P/S can be a useful tool and an integral part of the fundamental analysis.
⇐ Key to making money with stocks. Lesson 5. P/E Ratio Key to making money with shares. Lesson 1. How to pick stocks ⇒