1. Founding and Evolution of Procter & Gamble
2. Fundamental Analysis of Procter & Gamble
3. Technical Analysis of Procter & Gamble
Why does Procter & Gamble have such an interesting name? The answer is simple. The company’s history dates back to 1837 when a candle maker William Procter met a soap maker James Gamble purely by chance. This acquaintance happened thanks to the sisters they were married to.
Today, Procter & Gamble is an American multinational corporation with offices in 70 countries worldwide. It is one of the leading manufacturers of consumer goods and a part of the defensive sector with a 14.86% share in XLP (Consumer Staples ETF).
It’s not uncommon that we buy branded household goods without really paying attention to the company that manufactures them.
Below is a list of Procter & Gamble products everyone most likely knows about:
These are the most famous brands that help us get a proper picture of the company’s operation scale and its relatively stable business.
Why is the XLP sector defensive rather than cyclical? That’s because companies are more or less stable when facing the crisis because people will still continue eating, taking medications, paying utility bills, taking showers, and brushing their teeth.
The company’s development was dynamic. Since its incorporation in the crisis year of 1837 and until 1859, sales had reached $1 million. During the American Civil War, the sales went up several-fold as the contracts for the supply of candles and soap for the army of northerners were concluded. So, the initiative and being in the right place at the right time worked in favor of Procter & Gamble.
In 1931, a brand management system was introduced, and in 1946, the well-known Tide detergent came into the picture to save our clothes from stains.
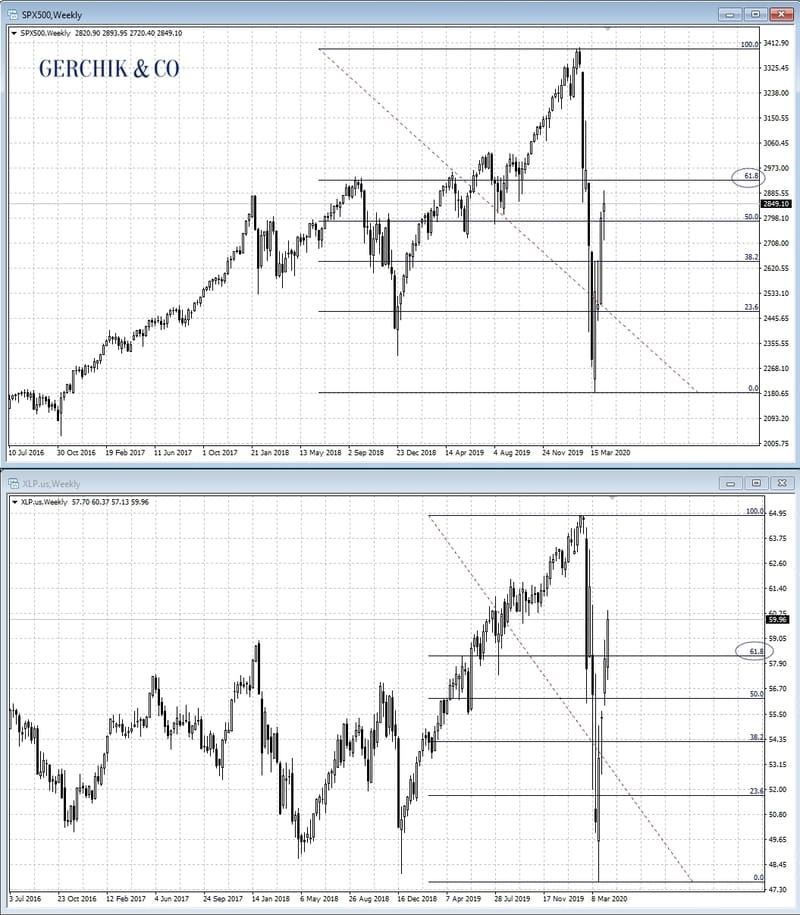
In 1957, the company took over a toilet paper manufacturer Charmin Paper Company. Seeing people hoard toilet paper at the stores, I figured that during the Covid-19 pandemic this company would not lose its ground against the backdrop of overall market developments. By simply comparing the SPX500 chart and the XLP chart, we can see that the consumer sector is ahead of the reference index.
(1).jpg)
Diapers, along with Head & Shoulders shampoo appeared in 1961. Crispy Pringles appeared five years later. The 80s were rich in a series of takeovers:
In 1991, the company purchased Revlon’s MaxFactor and Betrix. In 1992, it bought another famous brand of hair care products Pantene Pro-V.
In 1993, following a major restructuring, 30 plants were closed with 13 thousand employees being laid off. After that, a new wave of acquisitions begins. In 2003, Procter & Gamble bought the German hair care company Wella, and then Gillette in 2005 for $56 billion.
It is interesting to see how the company adapts to market conditions from the complete cessation of candle production by 1921 to the shutdown of inefficient plants in the 90s and the reduction of 60% of brands in 2014.
With 97,000 employees, Procter & Gamble has a market cap of $300 billion. Dividends of 2.45% slightly exceed the market figures (SPY being 2.24%). Unlike technology companies with relevant volatility, super profits, and super drawdowns, Procter & Gamble’s profit margins look as follows:
PROFIT MARGIN FIGURES ARE PRETTY SOLID:
As far as the revenue dynamics goes, the company is considered stable, generating $65–67 billion over five years. The benchmark for net income is $9-10 billion. So, the company manages to maintain the price level of $3.6 profit per share for years.
With the current price, P/E will be around 34. Let's take a look at the quarterly reports: the company is able to maintain a benchmark of $1.20–1.30. Unlike others, the current pandemic had no major impact on the April quarterly figures. With the forecasted $1.12, PG reports $1.17. Even with reported $1.20, company’s EPS can reach up to $4.8 per annum. This means that P/E is heading towards 25.
Those, who did not get the chance to buy and believed Armageddon predictions, got their hands on not exactly the most appealing prices, while the correction allowed buying in the area of 95, where the P/E was 19.
(1).jpg)
Open an account and start trading CFDs on Procter & Gamble stocks
Even though this sector is less volatile, the correction for the 27% stock went in the similar fashion as in terms SPY. However, with recovery, the reward turned out to be higher. Pharmaceutical, consumer goods, and public utility companies sparked keen interest. Procter & Gamble started recovering at mirror level 95. At 120.82, with consolidation, the company continues to go up as the buyers keep demonstrating initiative.
(1).jpg)
Аutor: Viktor Makeeu