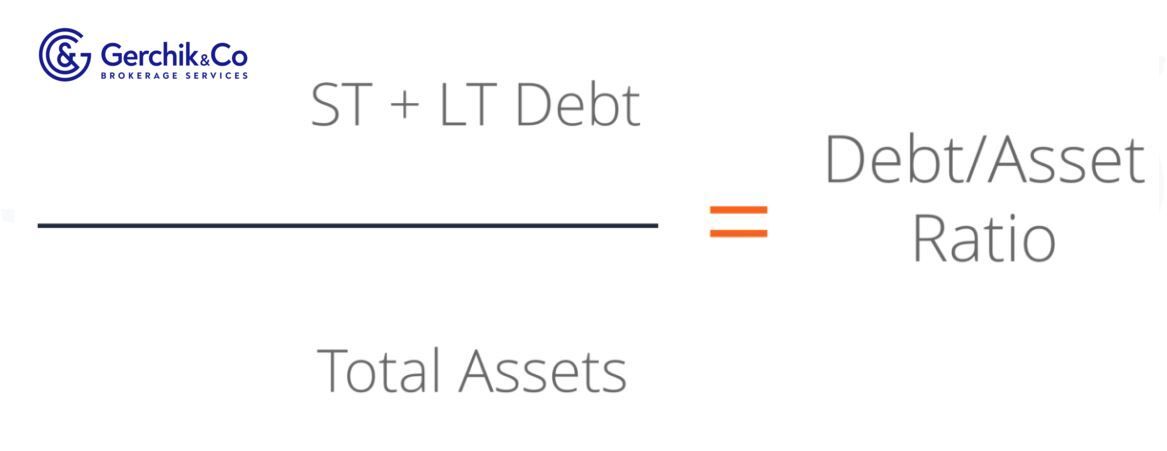
Debt to Asset = (Short-Term Debts + Long-Term Debts) / Total Assets
According to the formula, you need to divide all short-term and long-term debts (total debt) by all current and non-current assets (total assets).
The data for the numerator and denominator are available in the company’s balance sheet.
Total debt (see Lesson 19 for a definition) is the sum of all short-term and long-term debt and other fixed liabilities that arise during a work cycle.
Assets are the total amount that includes all current and non-current assets on the company’s balance sheet.
1. If the ratio equals one (= 1), this means that a company has the same amount of liabilities as the size of its assets. This proves that a company has a high level of leverage.
2. If the ratio is more than one (>1), this means that the company’s liabilities exceed its assets. In other words, a significant portion of its assets are financed with debt. This proves that a company is extremely leveraged and highly risky to invest in.
3. If the ratio is less than one (<1), this means that a company’s assets exceed debts and it can meet its obligations by selling assets, if necessary. The lower the ratio, the lower the risk for a given company.
Company 3 has some higher leverage compared to other companies in the sample. On the one hand, the degree of this company’s financial flexibility is low. Therefore, it may face an increased risk of insolvency if interest rates go up.
On the other hand, if business management is efficient and can keep a company financially stable for a long time, Company 3 can count on the highest profitability thanks to leverage.
All other things being equal, Company 2 shows the lowest risk and lowest expected return.
1. Let’s now calculate the total debt for quarter ended in Septemer 2020:
Total Debt = (Short-Term Debt + Fixed Payment Obligations) + (Long-Term Debt + Fixed Payment Obligations) = ($551 + $100) + ($547 + $5,479) = $651 + $6,026 = $6,677
2. Total Assets for the quarter ended in September 2020 are $40,551.
3. Now let’s measure Debt to Assets for the quarter ended in September 2020:
Debt to Assets = Total Debt / Total Assets = $6,677 / $40,551 * 100 = 16.47%
Interpretation: the leverage for every dollar of NEM assets is 16 cents.
4. From a dynamic perspective, #NEM Debt to Assets has been shrinking over the past five years. In 2019, it was 17.09%. A decrease in the portion of outside financing is observed too.
5. Now we shall compare it with industry peers with similar capitalization. Let’s take Barrick Gold Corp #GOLD 0.11 for example. As we can see, both companies have a low Debt to Asset ratio.
Open an account and start trading Newmont Corporation CFDs
Also, you’ll come across the Long-Term Debt-to-Total-Assets Ratio. What makes it different from Debt to Asset is that LTdebt/Assets factors in long-term liabilities only. We calculate the ratio using the company’s long-term liabilities for long-term debt and lease payments in relation to total assets.
LT Debt/Assets is a metric that shows the percentage of debt-financed assets that have a maturity of more than a year. It gives an overall assessment of a company’s financial position, including its ability to repay outstanding loans.
LT Debt/Assets Newmont Corp. for the quarter ended in September 2020 was as follows:
LTdebt/Assets #NEM = $6,026 / $40 551 * 100 = 14.86%
LT Debt/Assets has shrinked since 2019 (0.17). This may indicate that NEM is gradually getting less dependent on debt as far as its business goes.
As with any other metric, you need to assess Debt to Asset as follows:
1. To measure a company’s total risk analysts, investors and creditors use the Debt to Asset ratio. The lower the metric, the safer the company. A company with a higher Debt to Asset will be considered riskier in terms of investment and lending. If the ratio is going up steadily, this may indicate that a company is likely to lose its financial independence and suffer bankruptcy at some point in the future.
2. By using Debt to Asset, investors can understand what portion of assets a company finances with debt rather than equity. This ratio helps you estimate the percentage of debt-financed assets and the percentage of assets financed by investors.
⇐ Key to making money with shares. Lesson 19. Debt to equity. Newmont corporation Key to making money with shares. How to pick stocks ⇒