Today, we shall be unpacking the least known but no less illustrative and helpful financial performance indicator––the free cash flow margin or simply FCF margin. In a nutshell, this metric reflects how well a company converts its sales into cash.
The free cash flow margin is a ratio of the free cash flow to total revenues i.e. sales.
FCF Margin = Free Cash Flow / Net sales * 100
1. Net sales (Revenue). Let’s take a look at the profit and loss statement. The first item on it is the net sales. In other words, these are the total revenues earned by a company. However, in order to determine the net sales, we need to deduct the amount of sales returns and allowances from total revenues.
2. Free Cash Flow (FCF). We can look these figures up in the cash flow statement or calculate them independently. In essence, the FCF measures the company’s ability to generate something that matters the most to investors. We are talking about the cash that can be further distributed as one deems fit.
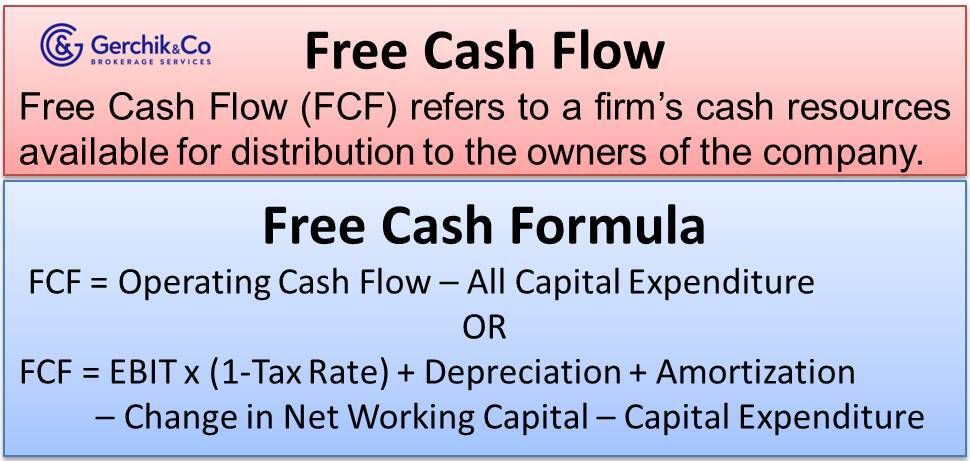
Free cash flow is essentially the cash flow from operations (CFO) minus capital expenditures. This is what the detailed formula looks like schematically:
EBIT (Earnings Before Interest and Taxes) * (1 − Tax Tate) + Depreciation & Amortization − Change in Net Working Capital − Capital Expenditures
.jpg)
FCF = Operating Cash Flow − Capital Expenditures
Margin = Free Cash Flow / Revenue * 100
For the quarter ended in March 2020:

For the quarter ended in June 2020:

For the quarter ended in September 2020:

By obtaining data over several time periods, we can see a bigger picture of the FCF margin. As far as dynamic goes, there is a clear uptrend. Essentially, this is a financial barometer that reflects the increase in the efficiency of trading activities aimed at creating free cash flow.
For the period ended in September 2020:
.jpg)
.jpg)
Following the dot-com bubble, the FCF margin for S&P 500 tech companies went up from 5% and reached 23% in August 2020.
.jpg)
1. From a practical perspective, if a company sells a product for one dollar, the FCF margin measures how many cents a shareholder can take home without suppressing its cash flow. This metric is especially insightful during a recession.
2. Maintaining the FCF margin is crucial for a very simple reason—the companies that use cash must always be on the lookout for new sources of capital. These sources can either run dry or become too expensive unless the company demonstrates that it’s capable of generating positive cash flow.
A company with revenues that are unable to generate steady cash flow will face a fading interest of investors. Ultimately, the company will have to prove its ability to ensure free cash flow even if it takes a while to do that.
3. If you are planning to apply FCF margin for evaluation of the investment opportunities, analyze various cash flow margin indicators using successive time periods and make sure the figures are consistent.
⇐ Key to making money with shares. Lesson 15. Net Profit Margin. Procter & Gamble Key to making money with shares. How to pick stocks ⇒