Gross margin is an indicator expressed in percent of the sales and used to calculate the profitability of the company. No other expenses except for the cost of the goods sold are included in it.
In other words, gross margin demonstrates the percentage of profit in each currency. This is basically a percentage of the total profit made after deduction of direct expenses associated with the production of goods and/or services.
The higher the gross margin percentage, the more money the company has for liquidation of obligations and/or covering expenses.
In essence, investors measure net profit margin along with gross margin. This indicator is very handy in correlation with other equivalent indicators.
The margin can vary dramatically from industry to industry. A comparison of the gross margins of companies within one industry provides an insight into the financial solvency of the company. A higher gross margin indicates a sound performance and well-being of the company.
Gross margin is the share of each currency in sales volume. With a 20% margin, a company generates 20 (cents) for each currency (U.S. dollar) made through sales.
There is an inverse correlation between the variables of inventory turnover and gross margin. The smaller the value of inventory turnover, the higher the gross margin, and vice versa.
Gross margin allows:
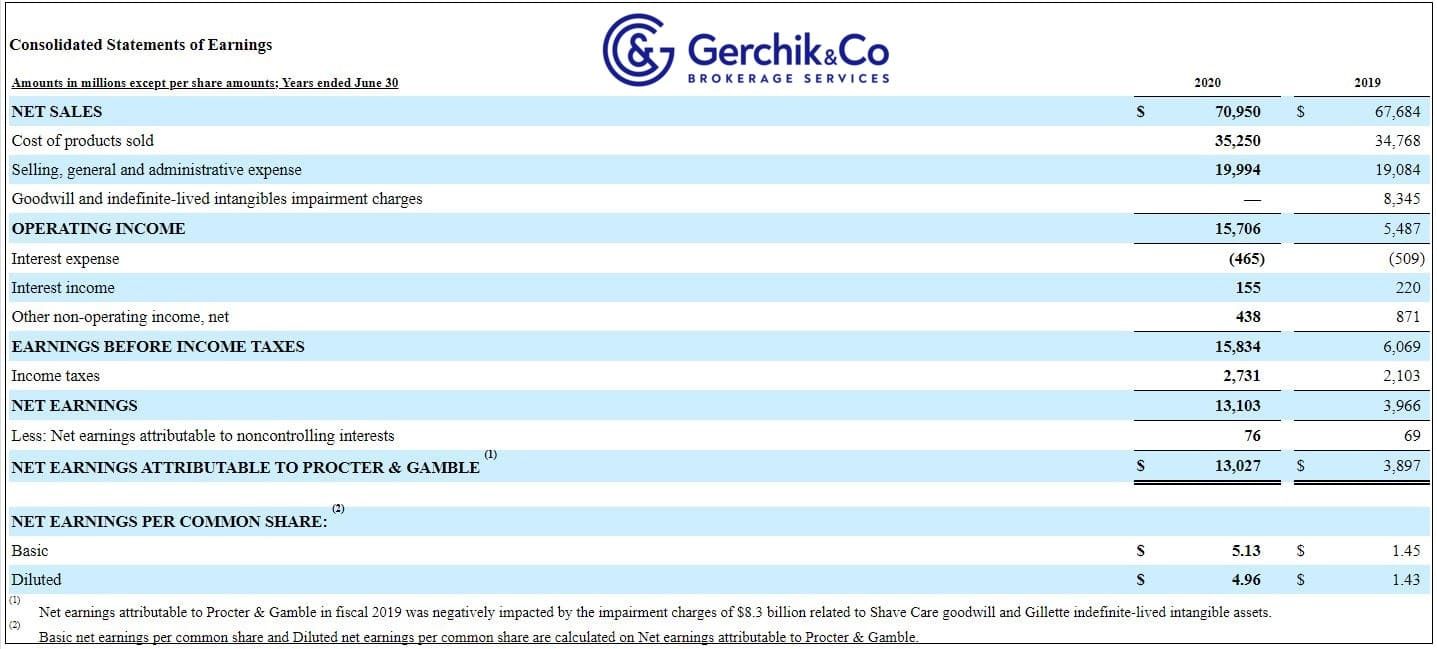
1. Let’s calculate this company’s gross margin for the accounting year that ended in June 2020.
Gross Margin % = Gross Profit (Jun 2020) / Net Sales (Jun 2020) = (Net Sales-COGS) = (70950 - 35250) / 70950 = 50.32 %
(1).jpg)
2. Gross margin for the quarter that ended in September 2020.
Gross Margin % = Gross Profit (Sep 2020) / Net Sales (Sep 2020) = (19318 - 9142) / 19318 = 52.68%
(1).jpg)
3. The P&G's gross margin is higher as compared to the majority of consumer goods companies. Industry average GM is 26.66%.
.jpg)
4. In real-time mode, P&G’s gross margin has been gradually increasing since 2018. The minimum value totaling 47.91% was recorded at the end of 2018.
.jpg)
Aside from gross profit, you need to take a closer look at other financial markers in order to do a full-fledged analysis of an investment object.
On top of that, it’s essential to consider factors affecting gross margin. It is the accurate ratio of income and expense items that allows to determine the actual level of gross margin.
⇐ Key to making money with shares. Lesson 12. EPS. Zoom VS AT&T Key to making money with shares. How to pick stocks ⇒