Traders use assessment ratios to determine the company’s current value and thereby find out whether it’s undervalued or overvalued.
✅ Average interest rate on deposits per annum — 10 %
✅ Trader’s average annual profitability — 50-100 %
Open an account and make more money than in the bank!
(1).jpg)
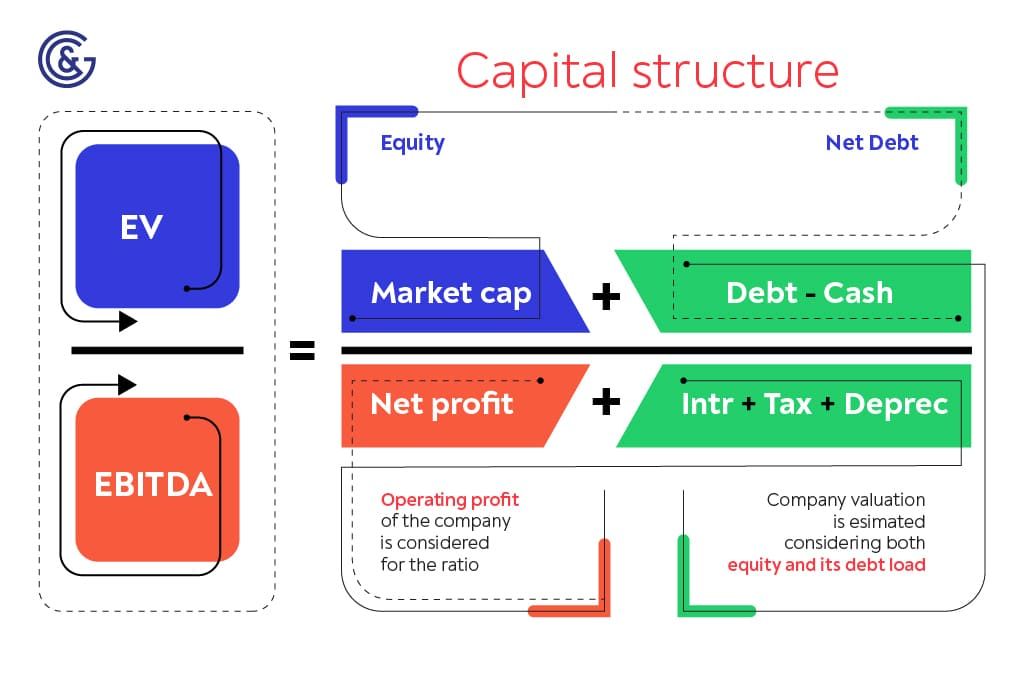
Element 1 — EBITDA — see Lesson 25.
Element 2 — Enterprise Value (EV).

We can determine the market cap by having the current share price multiplied by the number of securities placed. The market cap isn’t intended to represent the company’s book value. It shows the company’s value as determined by market players.
EV = Market Capitalization + Market Value of Debt − Cash and Equivalents
EV = Common Shares + Preferred Shares + Market Value of Debt + Minority Interest − Cash and Equivalents
P/E = Market Price per Share / Earnings per Share = Market Cap / Net Income
EV/EBITDA = (Market Capitalization + Market Value of Debt − Cash and Equivalents) / (Net Income + Interest + Taxes + Depreciation + Amortization)
EV/EBITDA is a kind of alternative to P/E. P/E and EV/EBITDA ratios seem to be two different ratios, but they have a common ground: “company’s value” in the numerator and “profit” in the denominator. The difference is what is considered to be the company’s value and profit for calculating the ratio.
Although P/E is one of the most popular ratios, EV/EBITDA is more efficient. We recommend using these ratios in tandem. Investors would be better off using EV/EBITDA to see how much they’re going to spend. This way, they’ll get a more realistic view of the fair value.
1. #СМСSA EBITDA for the accounting year ended in December 2020 totals:
EBITDA = Net Income + Interest + Taxes + Depreciation + Amortization = $10,534 + $167 + ($4,588 − $1,160) + $3,364 + ($8,320 + $4,780) = $30,593
.jpg)
2. #CMCSA EV for the accounting year ended in December 2020 totals:
EV = Market Cap + Preferred Stock + Long-term Debt & Capital Lease Obligations + Short-term Debt & Capital Lease Obligations + Minority Interest – Cash & Cash Equivalents = $240,026 + 0 + $100,614 + $3,146 + $1,415 − $11,740 = $333,461
.jpg)
3. #CMCSA EV/EBITDA for the accounting year ended in December 2020 totals:
EV/EBITDA = 333,461 / 30,593 = 10.90
In the curse of the previous four years, #CMCSA EV/EBITDA has not exceeded 10х. In 2020, the ratio increased slightly, with EBITDA dropping and EV increasing. Overall, an indicator that is less than 10 is quite attractive.
.jpg)
4. As compared to the figures by sector and similar companies, #CMCSA has a normal value. The company is not overvalued.
(1).jpg)
.jpg)
Open an account and start trading top CFDs
1. There’s no standard rule of thumb for interpreting EV/EBITDA. This metric is different for different businesses, depending on nature, product demand, competition, profit margins, and capital requirements. Therefore, it’s incorrect to compare this ratio in different industries. Of course, you can use it within the same sector and shed light on the company’s performance and valuation. Nevertheless, the standard multiple—10 (10x)—is usually considered to be the fair value.
2. If the ratio goes down thanks to an increased EBITDA or a decreased net debt (or both), it’s a favorable situation. If the ratio drops due to a decreased market cap, you need to find the reasons.
3. Higher EV/EBITDA metrics compared to similar indicators (industry average or historical) suggest that a company has a higher value.
4. However, if EV/EBITDA is lower compared to peers, then a company has a lower value. Consequently, lower EV/EBITDA metrics make a company an attractive investment—it looks undervalued, while its buyer can keep deriving benefits as long as the valuation reaches the industry average.
5. The above interpretation remains true if we compare participants of the same type within the same industry. If this is not the case, the ratio turns out to be incorrect. Note that high growth sectors see a higher EV/EBITDA metric, while low growth sectors see a lower one. Therefore, one shouldn’t conclude that a company is overvalued or undervalued only after a higher or lower valuation is presented.
6. EV/EBITDA helps compare two companies in different countries, as it avoids cases where the tax policy impacts profits. Tax structures are different, while this multiple completely bypasses tax restrictions and any similar distortions for valuation purposes.
Although EV/EBITDA isn’t a perfect metric, it prevails and helps find out whether the selling price is reasonable. It gives both parties an objective view of the M&A process. When used along with other ratios, such as P/B or P/E, rather than in isolation, EV/EBITDA gives comprehensive results.
⇐ How to make money in stocks. Lesson 26. EBITDA margin. Netflix vs Comcast Key to making money with shares. How to pick stocks ⇒