The subject matter of today's article is the head and shoulders pattern, which we are going to examine on a chart, and learn how it is formed, how to interpret its occurrence and and what steps should be taken, when it is confirmed.
In technical analysis, head and shoulders is a reversal chart pattern that occurs following a long upward price movement.
There is also a bullish model of this pattern which is formed at the end of the descending chart and is referred to as the inverse head and shoulders.
In the Forex market, the head and shoulders pattern is extremely popular among traders, since it is believed to be one of the most reliable trend reversal patterns.
This pattern is indicative of a previous trend slowdown and the beginning of a new trend in the opposite direction. It is pretty easy to determine it on the chart.
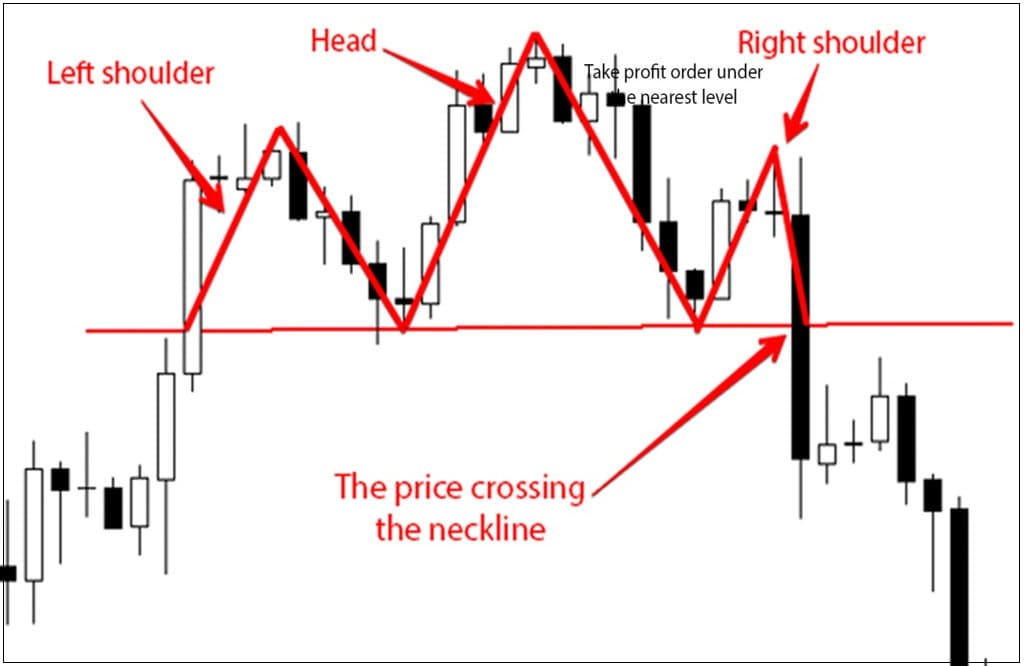
The head and shoulders pattern is comprised of three consecutive peaks: the one in the middle is the head, and the other two peaks on the sides slightly lower are the shoulders. The first peak is formed as a regular rollback during an uptrend.
The price reaches a new high and rolls back. Once this happens, there is another movement exceeding the first peak under the pressure of the buyers.
This peak must be the uptrend’s highest point. After reaching the high, the price starts to drop, forming the second bottom on the chart.
At the level of the second bottom, the buyers become more active and start dictating their conditions in the market all over again. As a result, the price goes up, reaching a local high which is slightly lower than the previous high. This last peak will be deemed the second shoulder of the graphic figure.
In the classic example of this pattern, the shoulders have to be at about the same level and located approximately at the same distance from the head, although this is not compulsive.
The head and shoulders pattern in the Forex will be considered a fully formed figure, only when it breaks the so-called neckline!
In order to identify it on the chart, you have to draw a line on the previous lows reached by the price after the first and second peak or left shoulder and head.
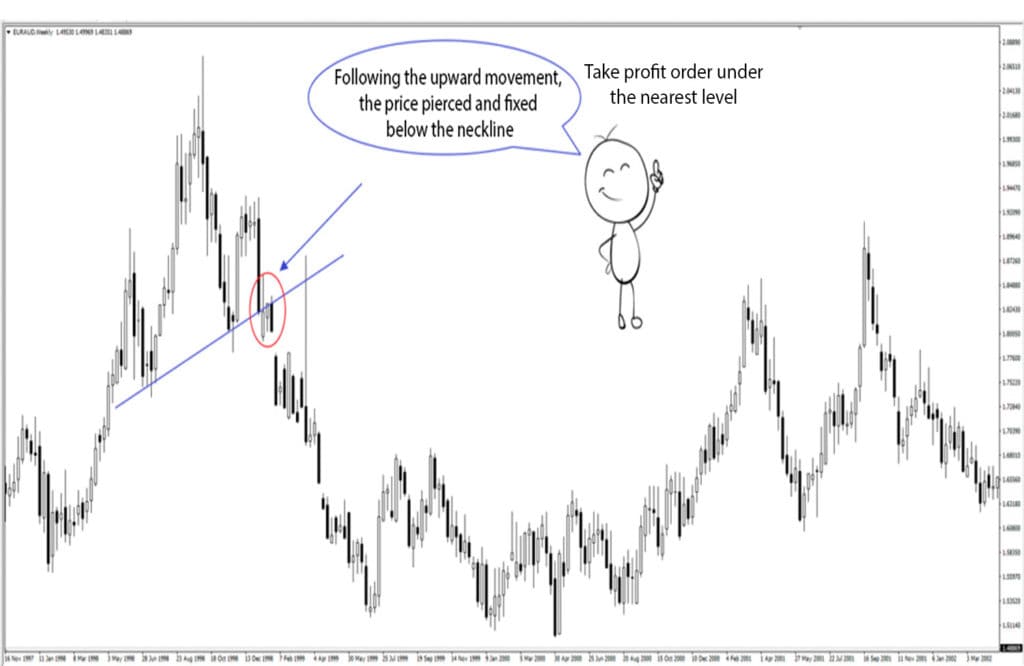
The neckline can be horizontal or slightly tilted upwards or downwards. We can talk about the trend reversal only when the price - after reaching the third peak - goes down and breaks the neckline which serves as a support level.
When the third peak of the head and shoulders pattern appears on the chart, we can observe the further behaviour of the price, when it is approaching the neckline.
If it breaks the neckline, we should wait for the candle to close below this level. After that, we can start looking for the entries to open the sell deals. When we open the deal, the stop loss order has to be placed slightly higher than the peak of the right shoulder.
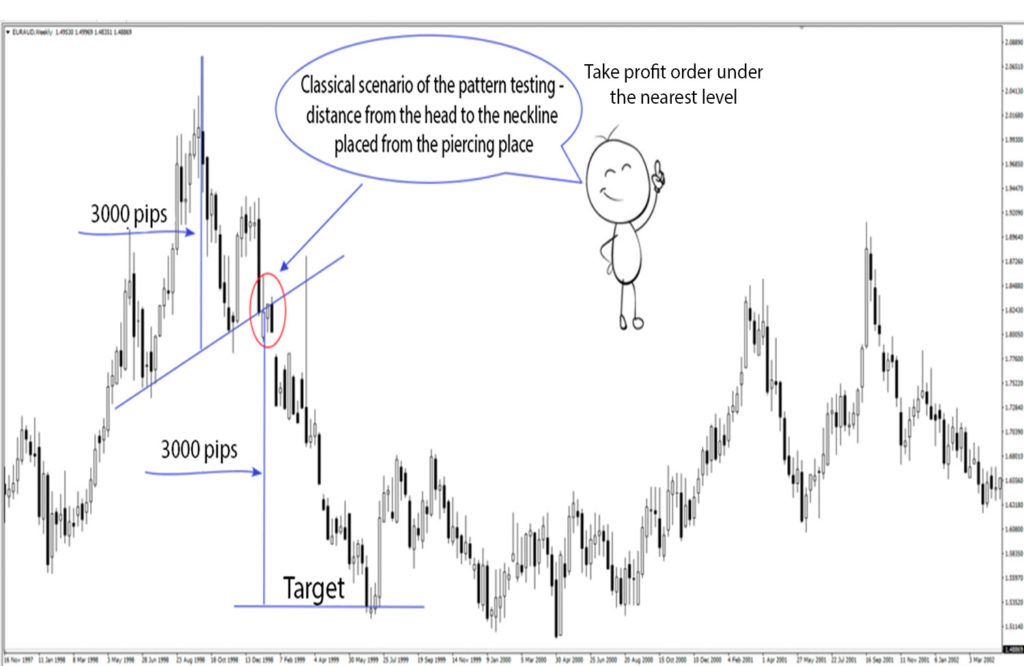
By measuring the vertical distance from the high of the head to the neckline, we can determine the potential of the descending movement. This will be the expected potential of the downward price movement.
There is another way to open a sell deal after the head and shoulders pattern has been identified. This method is the second chance for those who were not quick enough to open the deal immediately after the breaking candle closed and the price dropped.
In some instances, after the price has dropped, passing a certain distance downwards, the rollback may happen on the chart towards the neckline which has changed from support to resistance level following the breakout.
If the price is unable to go higher and starts bouncing off the neckline, we can open a sell deal and place the stop-loss order a little higher than the rollback beyond the neckline.
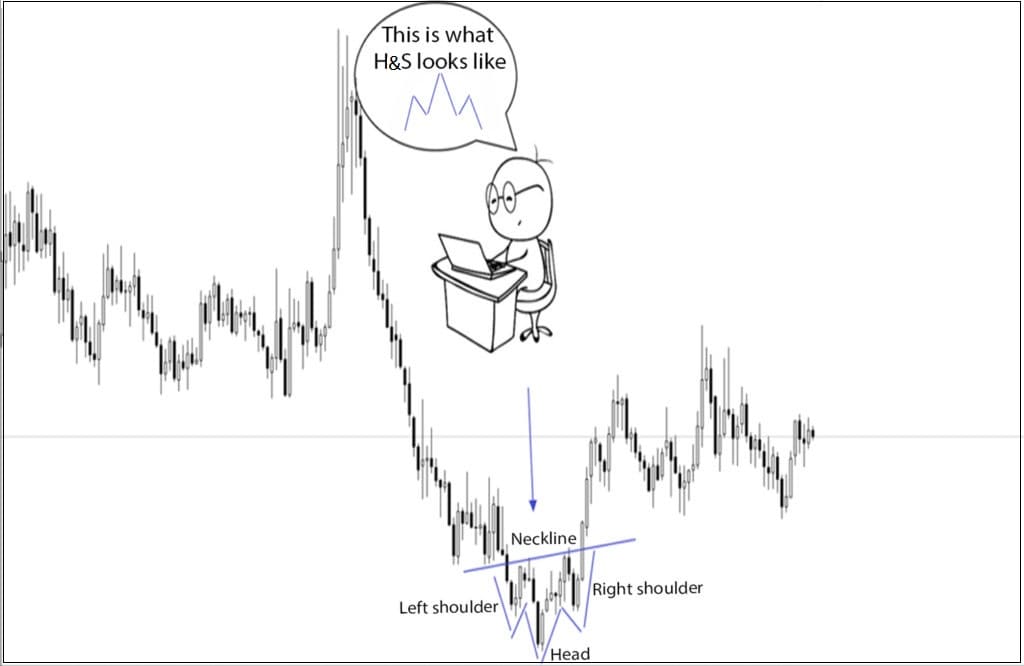
Next up, let’s take a look at the inverse head and shoulders pattern in the technical analysis. It is a reversal pattern appearing on the chart at the end of a long downtrend.
Its formation starts with the formation of the left shoulder, followed by the rollback and continued price drop below this bottom.
As a result of this drop, the downtrend reaches a final low, whereupon the price goes up and the head is formed.
This increase results from the closure of sell position and opening of the long positions by the players.
However, after a certain growth, the sellers still hope for a further price drop and believe that only a corrective movement is happening in the market which shall be followed by further drop.
They start lowering the price, until they encounter a strong push-back of the buyers in their way which is followed by the price rise. When we see the price starting to go up again, we need to identify the point where the inverse head and shoulders pattern will be deemed fully formed.
In order to achieve that, we should draw a line on local highs which are located on both sides of the inverted head. When the price breaks the neckline from the bottom upwards and fixes above this level, we can talk about the trend reversal and the beginning of the upward movement.
We place the stop-loss order slightly below the right shoulder, and determine the price movement potential, as we did in the previous example by measuring the distance from the head to the neckline. Another way to open a long position is to enter at the price rollback to the neckline after the upward movement.
In this situation, the neckline will serve as the support level. In accordance with the stop loss placement rule, it has to be slightly below the neckline level, which the price bounced off.
In this article, we have examined two reversal patterns, namely the head and shoulders and its inverse copy. We have figured out when it occurs on the chart, how it is formed, and what signals it provides for the position opening.
Login in Personal Account