1. Information on Chevron
2. Fundamental Analysis of Chevron
3. Technical Analysis of Chevron
Panic and rock-bottom prices often offer glorious opportunities, while rush and calm make us think about liquidating our positions. This is what we can see in the market on a regular basis. The crowd is afraid to buy until the whole situation settles down completely. There is always something to blame: trade wars, oil conflicts, or virus.
While the market is soaring, the mass media outlets are promoting the reasons why it is dangerous to buy anything in expectation of second and third bottoms or a replay of the Nikkei scenario in the 90s. As soon as the market quiets down, and the Federal Reserve System states with confidence that the economy is supposed to grow stably, we face crises in 2008 or 2020. Nevertheless, we will always have a reason to move forward.
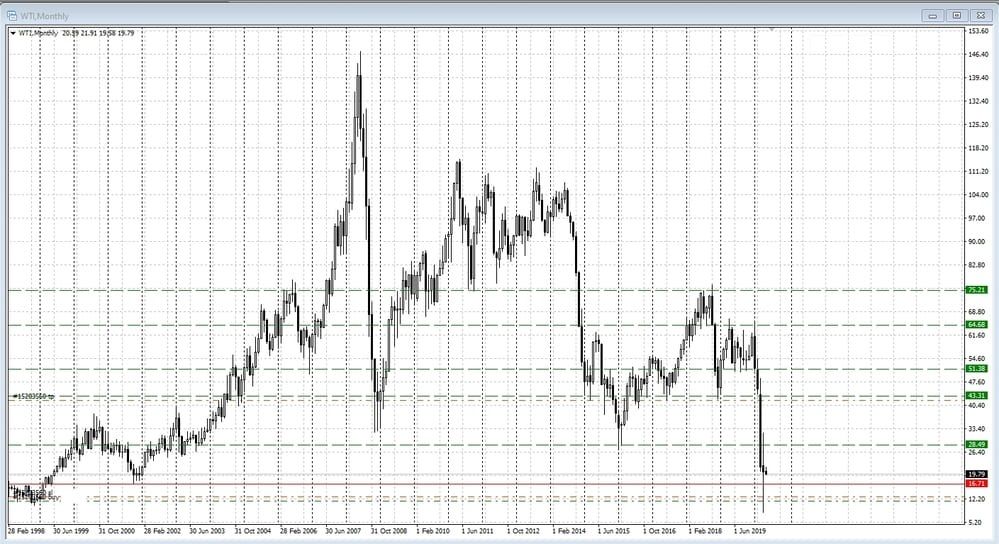
This is what happened to Chevron, an oil and gas company. Looking at oil prices in 1998–2000, a reasonable investor would say that this state of affairs affects the revenues, which bodes no good for the company. The instrument will simply not land on the observation checklist.
(1).jpg)
A few days earlier, the price for the May contracts collapsed below zero — it dropped to as low as - $40 a barrel. There are two reasons for this: no space to store oil and impacts of derivatives. The drop affected the traders’ capital: only Interactive Brokers reported a loss of 88 million U.S. dollars in oil futures trading. Against the backdrop of the slowly reviving economy, the same can be true for the June contracts.
All of these risks are certainly real. However, answer a few questions before you walk past this issuer:
Besides, we need to understand that no one will give oil away for nothing even in the medium term. If shale oil producers leave the stage, supply will decrease, while the price will start adjusting to long-term futures even if the second wave comes. Don’t forget to add the cost price, transportation, and inflation with a bunch of issued money as it becomes apparent that you just need to understand how stable the company is.
For starters, Chevron is next to Exxon Mobile in the list of US energy corporations and ranks among the most powerful companies in the world. Its largest deposits are found in the United States (29%), Australia (20%), and Kazakhstan (18%).
The company was founded by Frederick Tyler in Pico Well in 1879 — it was there that he managed to find the first oil. Later on, it started to distill heavy California oil into kerosene and to construct an oil refinery in San Francisco. Oil products were sold by Standard Oil, a monopoly of those times. You got that right — it is the Rockefeller who later bought Chevron for USD 761 thousand.
Fun fact:
In 10 years, production increases by 20 times and capitalization by 25 times — from USD 1 million to USD 25 million.
The company produced only 2.3% of the state’s oil and refined only a fifth of the total oil produced in California. However, it controlled 95% of kerosene sales and 85% of other oil products in seven states including California, Hawaii, Washington, and Alaska.
Did the company go through crises? Yes, it did. Let’s take a look at 1973 when the Arabian oil did not fall in price but went up by 4 times, and the company simply lost control. “Why give someone a tidbit if we can take it all,” the government of Saudi Arabia decided.
Next came a decade of challenges, business optimization, and job cuts. In 1984, the company bought Gulf Oil, a competitor with equal oil reserves. The deal was not successful as it paid the peak price, i.e., USD 13.2 billion. The falling prices forced the company to downsize 16 thousand employees and sell Gulf assets in Canada in addition to some gas stations. However, Chevron solved the problem. In 2001, it took over Texaco for USD 45 billion. To recap, those were the days of the dotcom bubble and economic downturn, but CVX had cash.
The year 2005 was marked by another deal — the company bought Unocal Corporation, and the year 2011 saw an acquisition of Pennsylvania-based Atlas Energy Inc. for USD 3.2 billion.
The company’s reserves amounted to 12.1 billion barrels of oil equivalent a year and a half ago.
With a market cap of USD 172 billion and 48,000 employees in total, the company has a good dividend payout history. Currently, one gets USD 5.16 per share, which is more than 6% when the price drops below USD 60. These are perfect dividends for a giant like that.
I have often heard financial analysts and consultants claim that the current market is not about dividend stocks. This statement is both controversial and relative. I would say that this is a matter of price! If we see that a company faces hard times, but an issuer generates billions of profits from year to year, and the P/E ratio is much lower than a fair price with such dividends, why not show a little more interest?
Let’s take a closer look at the quarterly reports: the company makes more than USD 1 per share consistently and also shows USD 1.93 in May instead of USD 0.65 as expected. It is clear that oil prices dropped relatively fast, and we will see sad figures in the second quarter. Nevertheless, we expect a period of balance.
(1).jpg)
Even if we keep in mind that oil prices are far from USD 100, and the average is around USD 1.5 and above (USD 6 per year are quite achievable) according to recent reports, then USD 90 per a CVX share are quite real. And this is what I put down when the issuer was collapsing.
It is clear that catching the bottom is a thankless task. In this case, I partially used some price benchmarks according to the foundation and technique. Next, I added it to my portfolio and got a good average of USD 65.
(1).jpg)
Upon reaching USD 90 and then USD 95, I reduced the position size by 50%. Why? It is because of a fast impulse and profits, taking into account a possibly doubtful upcoming report. Here is another reason: Royal Dutch cut its dividend. This means that this company is facing revenue problems. The same may be true for Chevron.
As the company is undervalued, the dividend yield is attractive. Much money is pumped into the market to get the most out of it, and a technical level is quite high. This offered interesting ideas. During the financial crisis in 2008, the price was about USD 56 when the problems were much more significant than a debt bubble.
Today, there is no concern about any debt burdens or liquidity crises. Moreover, a lot of money has been poured into the market, while the interest rate has been brought to a minimum. So why not increase?!
A false breakout at USD 56.10 was followed by an active buyback against the background of falling oil prices. Next, we left the local range of USD 79.83–87.97. Above the range, buyers retain their lead, so I will take into account the residual position and focus on how the price will behave above USD 87.97. If optimism starts to dwindle, I will reduce the position size by another 25% and leave 25% for dividends with the option to reenter when the prices are lower.
(1).jpg)
Аutor: Viktor Makeeu