
While market players' expectations are shifting in favor of the Fed taking the decision to slow down the pace of interest rate increase, the U.S. dollar remains under pressure for the second week in a row. Meanwhile, the representatives of the European Central Bank speak in favor of sticking to a stricter policy to help fight inflation.
Possible technical scenarios:
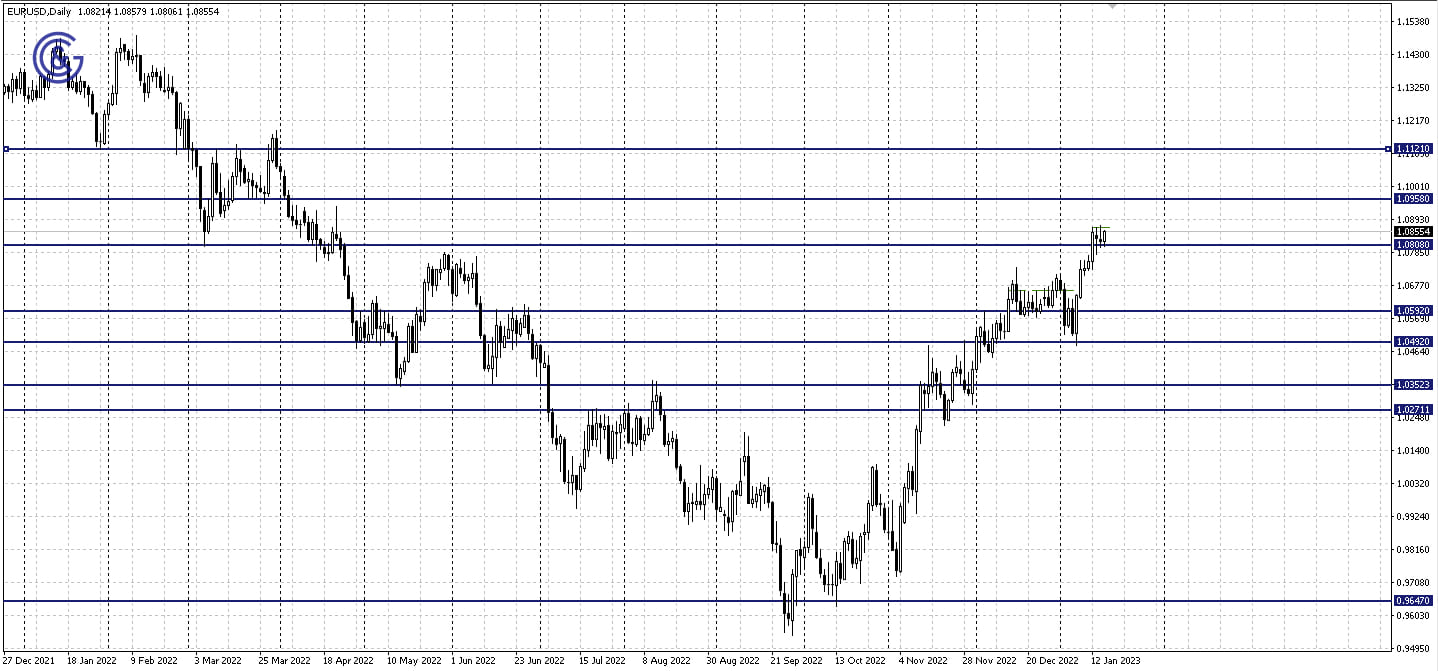
On the EUR/USD daily chart, the pair has gone up since last week, forming two bullish flags with the canvas of the second one being formed right now. Quotes have consolidated and are consolidating above the support at 1.0808, maintaining enough movement range toward the resistance at 1.0958.

Fundamental drivers of volatility:
This week, the European currency may be especially sensitive to inflation stats in the Euro area released on Wednesday at 10:00 am GMT and the ECB’s meeting minutes to be published on Thursday at 12:30 pm GMT.
The forecast does not suggest any major changes in the Consumer Price Index year on year which is projected at 9.2%. At the same time, it is expected to drop from -0.1% to -0.3% on a monthly basis.
As far as the United States goes, the critical news of the week will include Retail Sales and the Producer Price Index (PPI) which is one of the prominent indicators of inflation. Both figures will be released on Wednesday at 1:30 pm GMT.
The monthly change in the Core Retail Sales Index for the month of December is projected at -0.4% as compared to -0.2% earlier. At the same time, Retail Sales will drop 0.8% as compared to the 0.6% decrease a month earlier.
In addition, the United States Producer Price Index (PPI) for the month of December on a monthly basis is expected at -0.1% against the 0.3% increase earlier. Core PPI is projected at 0.1% as compared to 0.4% in the previous period.
Intraday technical picture:
On the 4H chart of the EUR/USD pair, the price has reached the 1.0361 local resistance marked by a dotted line. It may bounce off of it down and continue consolidating in the 1.0808 - 1.0361 range or break out its upper boundary. Subsequently, this may be followed by an increase to 1.0958.
The GBP/USD remains in the green area; however, its growth is likely to resemble a consolidation amidst a moderate weakening of the U.S. dollar. In the meantime, we are expecting a pretty eventful week in terms of the news background in the United Kingdom which may trigger the volatility spike of the pair and result in updated technical benchmarks.
Possible technical scenarios:
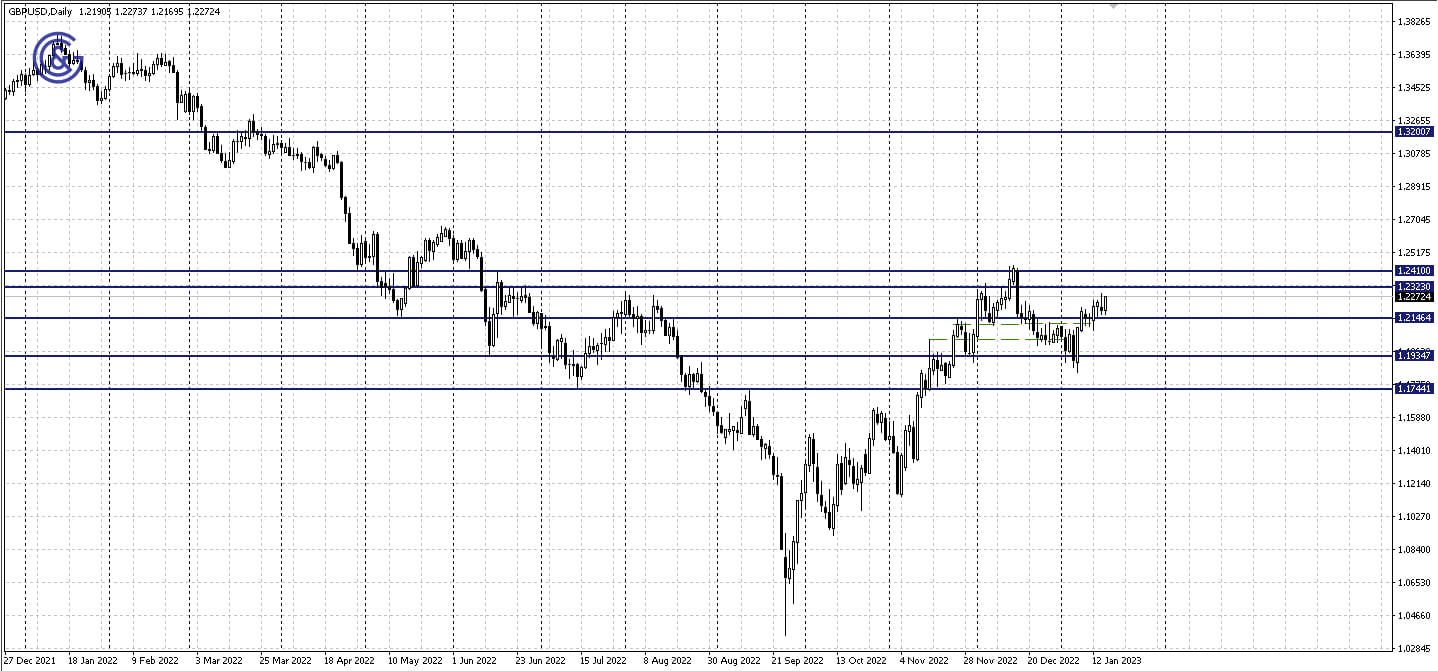
On the daily chart of GBP/USD, the pair remains within the 1.2146 - 1.2323 range where it can both continue consolidating and go up and keep increasing to 1.2410 after breaking out the resistance.
Fundamental drivers of volatility:
The United Kingdom inflation rate released on Wednesday and the Retail Sales expected on Friday may act as catalysts for volatility. Both reports will be published at 7:00 am GMT.
The Consumer Price Index for December is expected to remain at 0.4% month on month. On a year-over-year basis, it is expected to drop from 10.7% to 10.5%.
In the meantime, the dynamics of the U.S. dollar on Wednesday will be sensitive to the release of the Retail Sales and Producer Price Index (PPI) which is among the indirect indicators of inflation.
The Core Retail Sales Index on a monthly basis for the month of December is expected to reach -0.4% as compared to -0.2% earlier. Retail Sales are also expected to drop 0.8% against the 0.6% decline previously.
Producer Price Index (PPI) in December is expected to decline by 0.1% as compared to the 0.3% increase previously. At the same time, Core PPI is projected at 0.1% against 0.4% earlier.
Intraday technical picture:
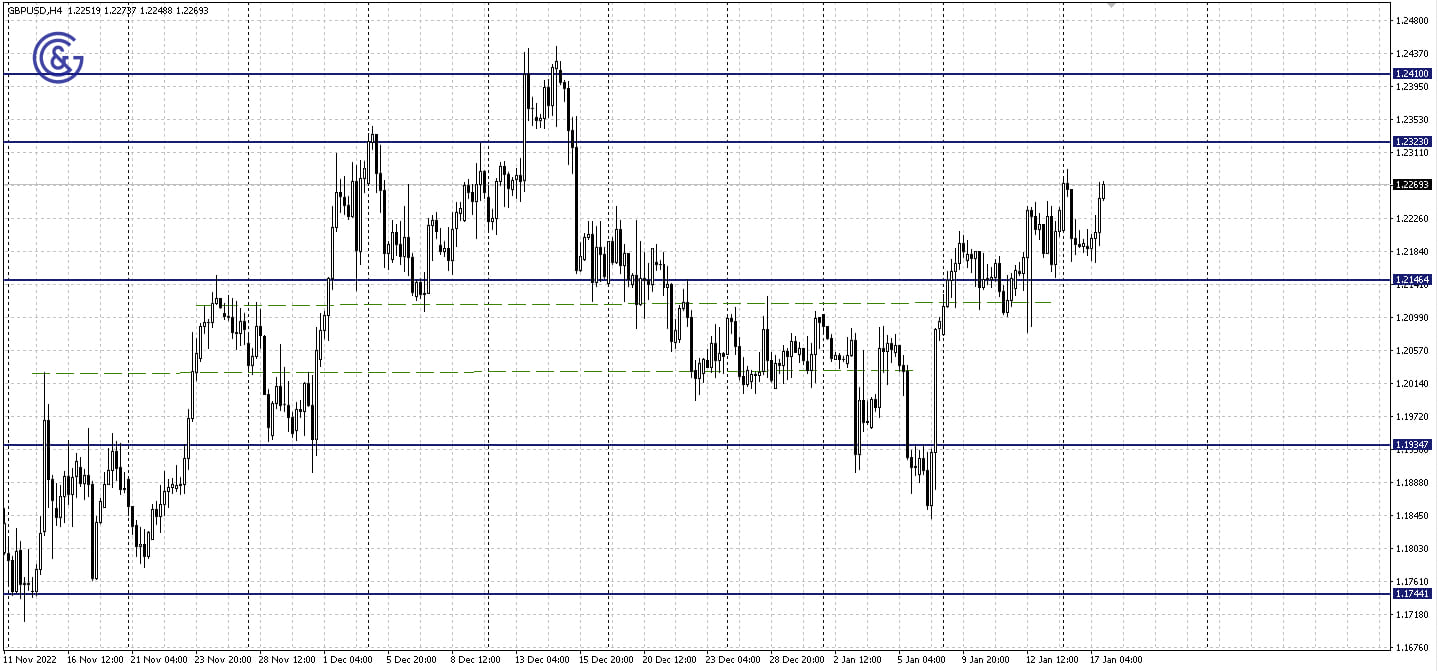
On the 4H chart of GBP/USD, we can see that the technical growth potential of the currency pair remains in the 1.2146 - 1.2323 sideways trend. A correction from its resistance is possible provided that the news release does not facilitate the spike of the pair.

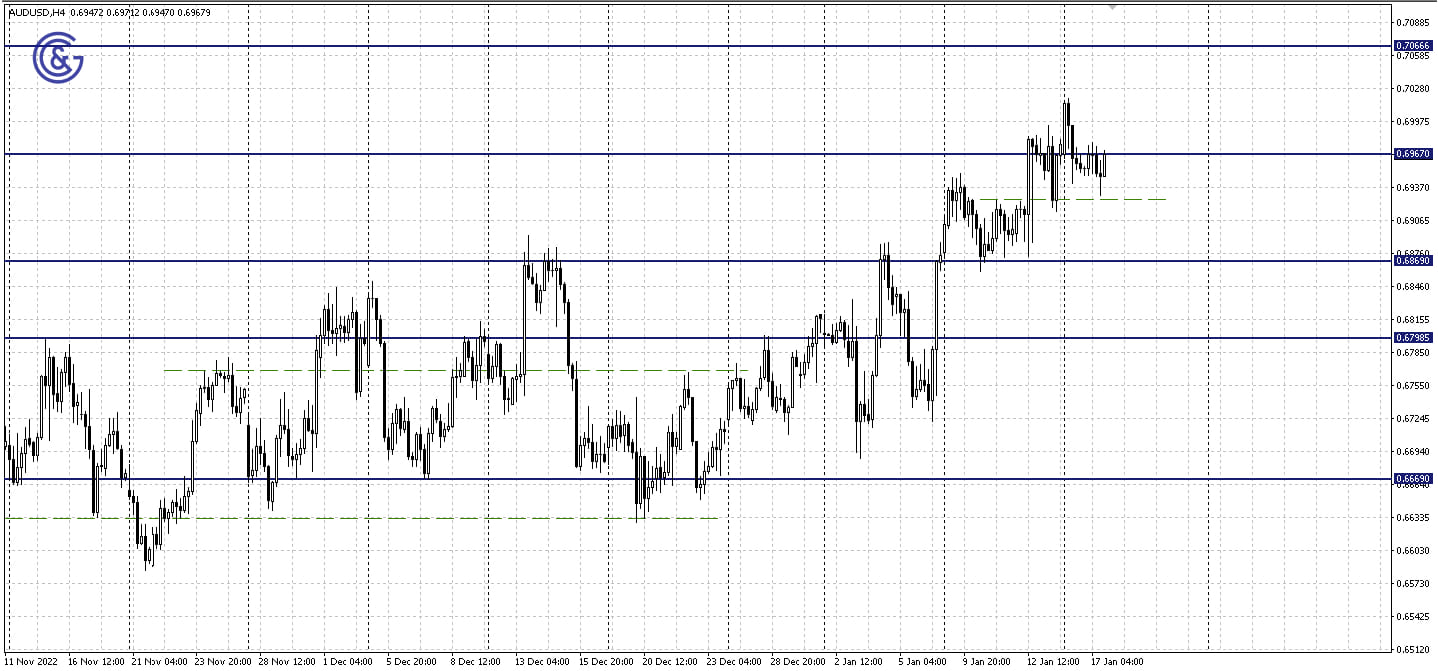
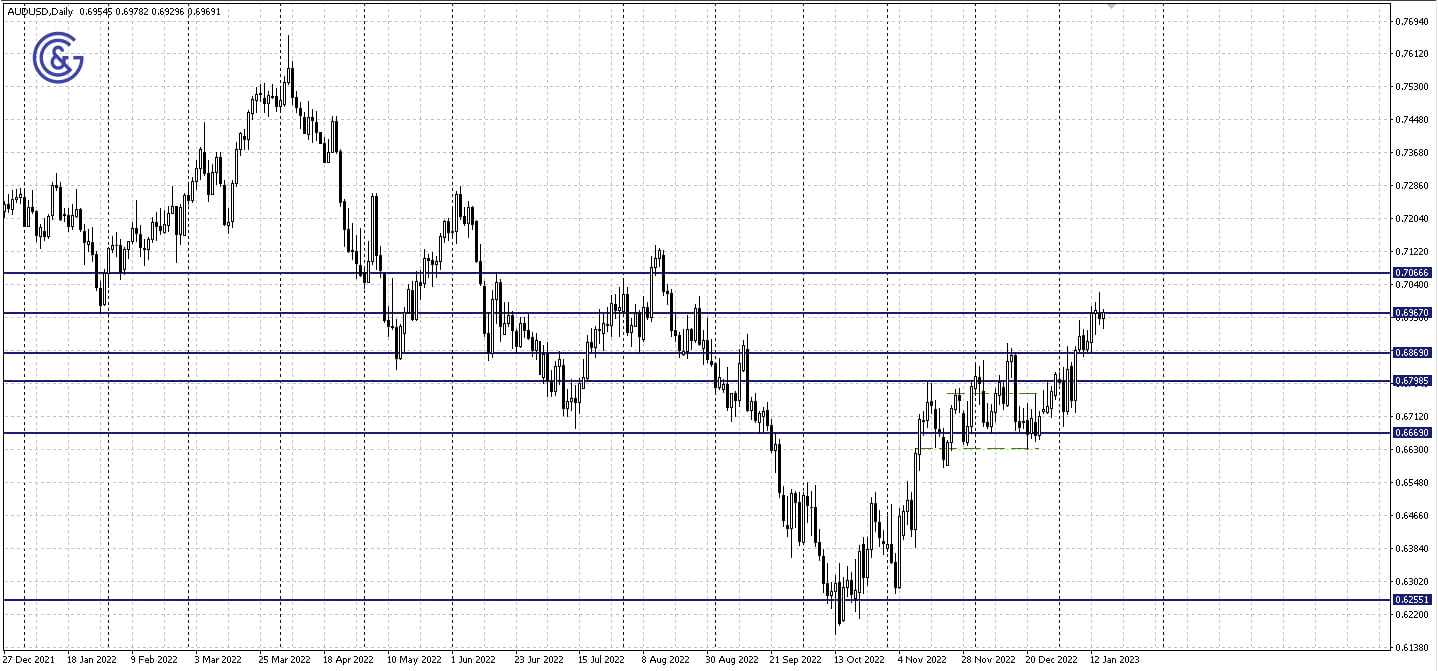
Fueled by the U.S. dollar’s weakness and optimism as China eases Covid restrictions, the AUD/USD pair has been getting stronger for the second week in a row.
Possible technical scenarios:
AUD/USD quotes on the daily chart are consolidating below the resistance at 0.6970. If the price manages to overcome it, 0.7066 will serve as the next growth target. A rollback to the support at 0.6869 may be an alternative scenario.
Fundamental drivers of volatility:
The Australian labor market stats to be released on Thursday may have a local impact on the dynamics of the Australian dollar in the pair. The change in the employment rate for the month of December is projected at 22.5 thousand as compared to 64.0 thousand in the previous period. In the meantime, the unemployment rate is expected to remain at 3.4%.
As far as the United States goes, the Retail Sales and Producer Price Index (PPI) figures will act as key catalysts for volatility on Thursday at 1:30 pm GMT. Because of its leading nature in terms of inflation, the U.S. dollar may be sensitive to these stats, especially if the final figures are higher or lower than those shown in the forecast.
The United States Retail Sales are expected to drop 0.8% as compared to a previous decline totaling 0.6%. In the meantime, the Producer Price Index (PPI) is expected to drop 0.1% on a monthly basis against the previous increase of 0.3%. Core PPI is projected at 0.1% against 0.4% earlier.
Intraday technical picture:
On the 4H chart of the AUD/USD pair, we can see 0.6925, a local support level marked by a dotted line. The highs reached on January 16 will be the nearest local growth target. Once they are updated, the pair may continue moving up toward the target at 0.7066.
