The forward P/E ratio is based on the projected earnings per share over the next 12 months and is used to calculate the price-to-earnings ratio. It’s calculated by dividing the current share price by the projected earnings per share.
There is only one difference between the P/E and forward P/E within one company—the amount of earnings we use to make a calculation. As far as the P/E ratio goes, we take the previous earnings as a basis, while the forward P/E ratio is about the projected earnings.
Just like the P/E ratio, the forward P/E ratio is an excellent indicator of a company's financial soundness too. However, every investor should analyze many other ratios to decide whether to invest in a company or not.
In terms of the forward price, the earnings yield formula is simply an extension of the P/E ratio formula.
Forward P/E Ratio = Market Price per Share / Projected Earnings per Share
Let’s analyze two components in detail.
1. The first component is the price per share. The market price is constantly changing. We need to divide the total market value (capitalization) by the number of outstanding shares to get the price per share.
2. The second component is the projected earnings per share. As an investor, you can check up on various sources or seek help from a financial analyst to find out the projected earnings.
Forward EPS = Projected Earnings / Numbers of Outstanding Shares of the Company
By using this formula, investors can find out how much the company can earn per share in the future and then apply the forward P/E formula.
Note:
1. The forward EPS is one of the options of the EPS analysis. It includes an estimate of the company’s projected earnings.
2. Be careful because this can be tricky. Calculating any future earnings can be rather inconclusive. Especially if you’re not an expert on a particular company. At times, even gurus can miss out on the potential future earnings.
3. On the positive note, if you do it right, you will notice some major market changes.
4. Regular traders should refrain from trying to estimate the future earnings per share on their own, but it’s important to be aware of this technique.
Now let’s examine two examples of the forward P/E ratio.
Let’s say you’re new to shares and have doubts about whether or not to invest in a particular company. You’ve calculated the key financial ratios, except for the forward P/E ratio.
We have the following information:
We shall calculate the forward P/E ratio by dividing it into two steps. First of all, let’s find out the market price per share and then the forward EPS.
Market Price per Share = Market Capitalization / Number of Outstanding Shares = USD 2 million / 200 thousand = USD 10
Forward EPS = Projected Earnings / Number of Outstanding Shares = USD 1 million / 200 thousand = USD 5
If we use the forward P/E formula, this is the value we will get:
Forward P/E = Market Price per Share / Forward EPS = USD 10 / USD 5 = 2
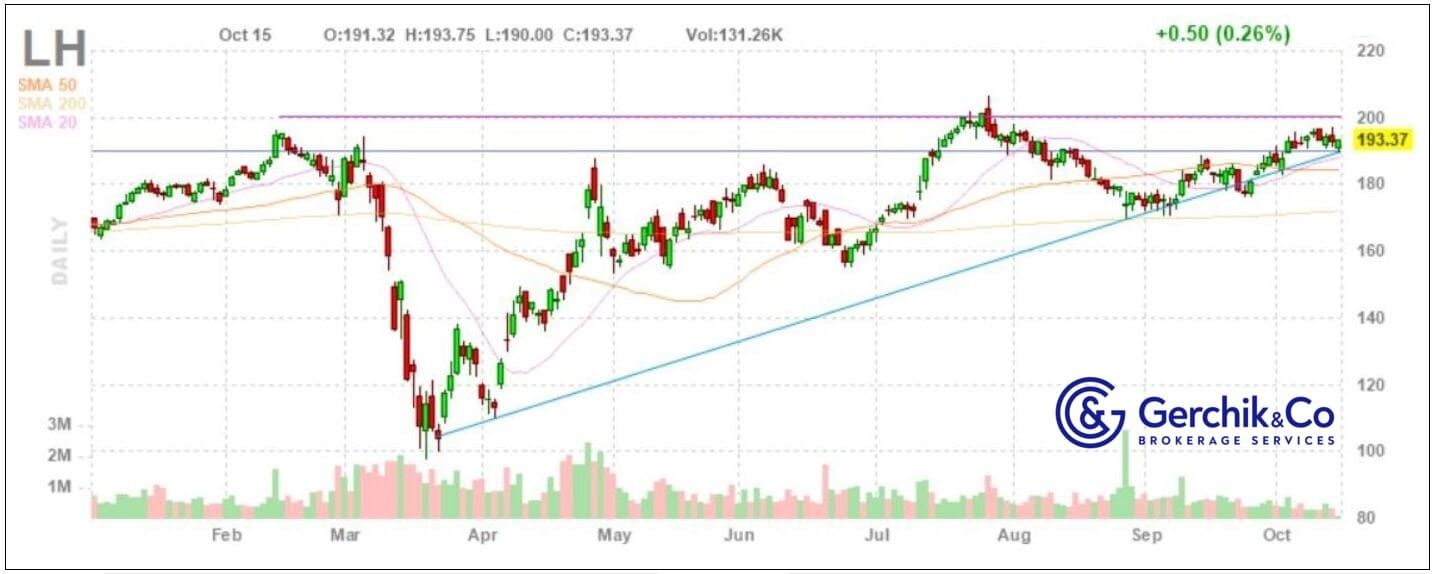
Consider the example of a promising company: Laboratory Corp. of America Holdings (LH). It offers medical diagnostic services, including those associated with COVID-19. It’s traded with the forward P/E of 12.42x, while the earnings are expected to grow by 9% in 2021 (data from exchange sources).
(1).jpg)
Forward P/E = Market price per share / Projected earnings per share
Forward P/E = Market price per share / Projected earnings per share = 193.37 / 15.53 = 12.45 (see the chart and table)
(1).jpg)
Conclusion:
Taking into account the industry average forward P/E of 17.57 (diagnostics and examination), the company is fairly valued.
The second company in this sector—DexCom, Inc. (DXCM)—provides healthcare services (diagnostics and examination).
(1).jpg)
Forward P/E = Market price per share / Projected earnings per share
Forward P/E = Market price per share / Projected earnings per share = 399.58 / 3.25 = 122.94 (see the chart and table)
(2).jpg)
Conclusion:
Considering the industry average forward P/E of 17.57 (diagnostics and examination), the company is significantly overvalued.
1. Many companies make their earnings recommendations when submitting quarterly or annual reports. Their projected earnings are simply how the managers interpret the future expectations, with a focus on estimating the earnings in the upcoming reporting period. Investors are allowed to use the official data or combine it with their own analysis to assess the earnings growth.
2. The forward P/E ratio should rather be seen as market optimism about the company’s growth prospects. The P/E ratio and the forward P/E ratio are especially useful when comparing similar companies in the same industry. The forward P/E ratio, which is higher than the industry average one, shows that the company is likely to grow significantly in the future.
3. The disadvantage is that the projected earnings may be incorrect, so you’ll get the wrong results.
4. There is a chance that the company’s management team will deliberately underestimate the projected earnings in order to exceed the consensus forecast. In addition, it may be forced to adjust the projected earnings under the influence of market changes. In this case, the management team needs to recalculate this indicator in order to better represent the company.
5. To avoid any subjective forecasts when you justify your investment project, it’ll be appropriate to consider the company’s future from different perspectives. Alternatively, you can use moving averages for this purpose. And you obviously need to research the company’s financial statements.
⇐ Key to making money with shares. Lesson 4. Peg Ratio Secrets to making money with shares. Lesson 6. Price to sales ratio (P/S). Tesla's case ⇒