One of the most burning questions that every newbie trader gets puzzled by is how to determine the profit potential in a trade. Knowing how to calculate the ATR will help to answer the above question in each specific situation.
Each asset, be it currency pairs, stocks, or commodity futures, has an average true range i.e. average value of volatility for a specific time period. We are going to use this tool as a roadmap along with other trading parameters.
1. How to Calculate ATR
2. How to Use ATR When Trading
3. The Example Illustrating How to Determine Stop Loss and Take Profit Based on ATR
4. How to Use the ATR Value with Different Strategies
We have already established what ATR is. In a nutshell, it’s an average range of price swings for a certain time period which is typically 14 days. Now let’s see how to calculate it.
The practice has proven that the last method in the list is the easiest and most effective one. So, we are going to focus on the manual calculation of the ATR.
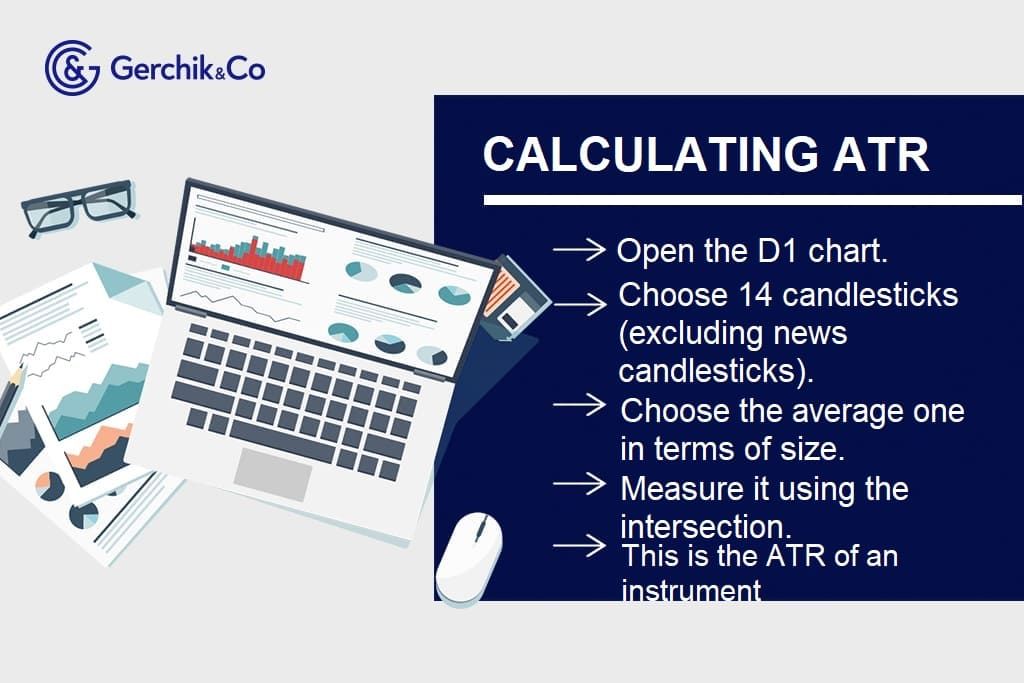
1. Open a daily chart of the asset you wish to trade.
2. Make a selection of fourteen candlesticks in a row.
3. Make sure that it doesn’t include any excessively large candlesticks which typically form at the news movement. If they got in your selection, skip them.
4. Choose the medium-sized one by eye.
5. Measure it by cross-section. This will be your ATR.
.jpg)
Now you know how to calculate ATR. But how can it be practically applied in trading?
1. The price travels its ATR in the course of a day.
2. The risk/reward ratio per position should be around 1:3.
3. It is better not to open a trade when the price has already traveled more than one-third of ATR.
Let’s take a look at the daily chart of the EUR/USD pair. In our selection, the medium-sized candlestick is 70 pips. As previously mentioned, the size of the candlestick can be determined by cross-section. For greater accuracy, you can subtract the low from the high.
.jpg)
In order to maintain a ratio of stop loss to take profit of 1:3, the recommended stop loss per trade is 20% of the ATR. The profit potential will be about 60% of the ATR (depending on the situation you see in the chart) respectively.
In our case:
This calculation is suitable for intraday trading strategies which stipulate the expected values of stop loss and take profit. If you keep positions open overnight or hold them for several days, ATR will rather serve as a cue.
Novice traders must keep in mind that a signal given by their trading strategy should be the only solid reason for entering trades. If you use one that you borrowed from a more experienced colleague, don’t forget that it may or may not factor in the ATR value.
If you develop a trading strategy on your own, it makes sense to add the ATR as one of the trade entry criteria. With that said, the ATR alone is not enough to make an informed trading decision. Remember that this indicator is just a tool that gives you a cue.
Suppose, you opt for the support and resistance trading strategy. According to experienced traders, the signal may sometimes fail to work even in case of a seemingly accurate entry point formed in the chart. E.g. The resistance level was broken out and confirmed as support by technical bounce but the price didn’t continue going up. The next time it happens, this will cause doubts about whether or not to open the trade.
1. Check out the percentage of ATR traveled by the price till this entry point.
2. If it exceeds 50%, it is likely that the subsequent movement in this direction will be hindered.
3. If there is a large movement range based on ATR, you can open trades safely.
There are subtle aspects you should be aware of when using this tool. You can get the hang of them on your own as you gradually build up your trading experience, or have a sneak peek at it from those who have already mastered the art of its use.
Being able to calculate the ATR is important for placing stop-loss orders and entering winning trades. These are one of the things that are covered by the Reboot Training Course brought to you by Gerchik. You will be able to learn how to use various trading strategies (breakout and bounce), how to place stop loss accurately, and enter the market when the time is right. This training program also highlights the topics of money and risk management, as well as trading psychology. Basically, there’s everything you need to know trade profitably!
Wish to boost the accuracy of your entries and strong level determination?
Use Real Market Volume!
Learn more about horizontal volume indicator