Forex trading charts are considered to be the primary tool that enables a trader to analyze the market and make a forecast on further price movements. It allows you to visualize how the quotations of an asset have changed, with the first part of charts showing time changes and the second part excluding chronological periods.
Today, let’s delve into the key types of charts that can be found in the MetaTrader 4 trading terminal and those that are not so popular and are seen as exotic. Based on this, each trader will be able to independently decide which chart to use for analysis.
1. Forex Trading Charts: Is There Any Difference
2. Line Chart
3. Bar Chart
4. Candlestick Chart
5. Kagi Chart
6. Renko Chart: A Compatriot of Kagi Charts
As we have mentioned, graphically represented prices allow you to visualize the market situation, do an analysis, and make a trading decision. We perform technical and indicator analyses on the basis of price charts that lay the foundation for most trading strategies.
A price chart is visually represented quotation dynamics of a trading instrument over time. A timeframe is a period needed to build one chart element. The most popular and frequently used indicators — line, candlestick, and bar charts — demonstrate chronological price changes, while exotic ones, e.g., Kagi and Renko charts, are not tied to time and mainly show changes in market trends.
Let’s take a closer look at each type of charts, discuss their advantages, and look into disadvantages.
.jpeg)
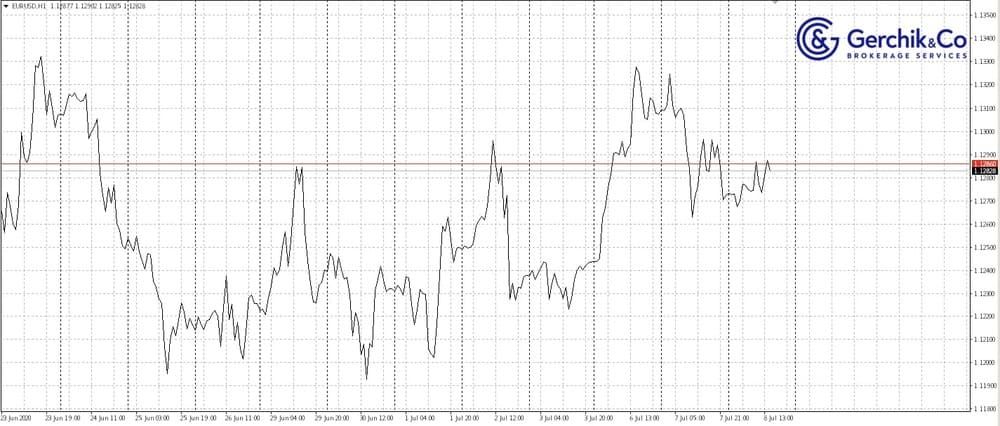
The name of the line chart speaks for itself—it shows price changes as a line. It should be noted that each timeframe (e.g., a 5M timeframe) helps find out four prices.
The first one is the price at which the timeframe opens. The second one is the maximum price over a period, while the third one is the minimum price. Finally, the fourth one is the closing price.
What is special about line charts is that they are based on closing prices, as these prices are considered to be the most important over a period. It helps smoothly sketch broad outlines of prices.
Major advantages:
Major disadvantages:
.jpeg)
The bar chart, unlike the line one, is more informative. Prices within the timeframe are presented as vertical bars with two horizontal notches.
One bar demonstrates price changes over a period. It is the difference between the maximum and minimum values. The opening price of the timeframe is marked with the left-hand horizontal notch (dash), while the closing level has the right-hand dash.
Accordingly, if the left-hand notch is lower than the right-hand one, we can say that this is a growing bar, i.e., the price has increased over a period. The bars showing a price drop are characterized by the upper left-hand dash and the lower right-hand dash.
Major advantages:
Major disadvantage:
.jpeg)
Candlestick charts are the most popular Forex trading charts. They have won recognition from most traders, as they are the most informative. Japanese candlesticks are long or short rectangles, often having vertical upper and lower dashes. The size of the rectangle, i.e., the candlestick body, depends on the difference between the opening price and the closing price within the timeframe. Vertical upper and lower dashes are extremes or shadows. The upper and lower ones connect the body with the maximum and minimum values over a period accordingly.
Unlike the bar chart, candlesticks make it easy to find out whether the price has dropped or has risen over a period. A growing candlestick usually has a white body (sometimes it is green), while a falling, or bearish, candlestick has a black or red one.
By using candlestick charts, you can easily determine how the price behaves within the timeframe. In addition, you can track trends and price levels. Certain combinations of candlestick are called candlestick patterns that allow you to make a forecast on price dynamics.
Major advantage of candlestick charts:
Major disadvantage:
.jpeg)
Let’s review the types of charts that can be considered to be exotic. These include the Kagi chart that, like the candlestick one, is originally from Japan.
It is not tied to time, which is its main difference from those described above. This helps focus on price fluctuations and current market trends.
The Kagi chart is displayed as vertical segments that, like the bars, are parallel to each other. These lines show a significant price movement in one direction. If the price change exceeds a certain coefficient, a new chart line is formed. Vertical segments are interconnected by horizontal lines.
It is important to take into account the thickness of lines in Kagi charts. Lines can be thick (‘yang’) and thin (‘yin’). A horizontal line that connects the growth with the fall is a ‘shoulder’, and the one that connects the falling and growing lines is a ‘waist’.
Major advantage:
Major disadvantage:
.jpg)
Renko is another nonstandard chart that is not tied to time. It aims to display only price changes. Like the Kagi chart, it is originally from Japan as well, and its name can be translated as a ‘brick’.
Renko charts visually resemble rows of bricks that form trends. These are rectangles, transparent or shaded, which demonstrate whether the price has been rising or dropping. An analyst can independently set the field length for the chart, i.e., a parameter that shows how much the price should change to form a new brick.
In the chart, the price drop is displayed as shaded rectangles, while transparent rectangles show the price increase.
In addition to the field length, a trader can set a visually represented price benchmark in the Renko chart. Most often this is the closing price, but it happens that traders set benchmarks using maximum or minimum prices.
Major advantage:
Major disadvantage:
Your choice of a chart depends on your strategy and goals. Japanese candlesticks are suitable for beginners, but you should keep other types at your fingertips. After all, each one can offer certain advantages. In this case, using a demo account is the best way to test the charts.
Make your trading more profitable
with horizontal volume indicator!
Learn more about the Real Market Volume