When it comes to the financial markets, the chart analysis implies not only the ability to find key support and resistance levels but also spot the patterns signaling that the price is going to reverse soon or the current trend is going to continue.
In our today’s article, we are going to review the entry signals that are given by the trend continuation pattern. You will get your hands on insightful tips on how to open positions. These will become a great addition to your trading strategy.
1. So, What Is the Trend Continuation Pattern
2. Flag
3. How to trade flags
4. Pennant
5. Triangle
6. How to use all trend continuation patterns to make money
Technical analysis patterns are essentially visual figures that appear in the charts. Some indicate that the price direction ran its course itself and the reversal is to be expected, while others point to the trend continuation.
Trend continuation patterns include flags, pennants, wedges, rectangles, and sometimes triangles. Below, we are going to examine some of them.
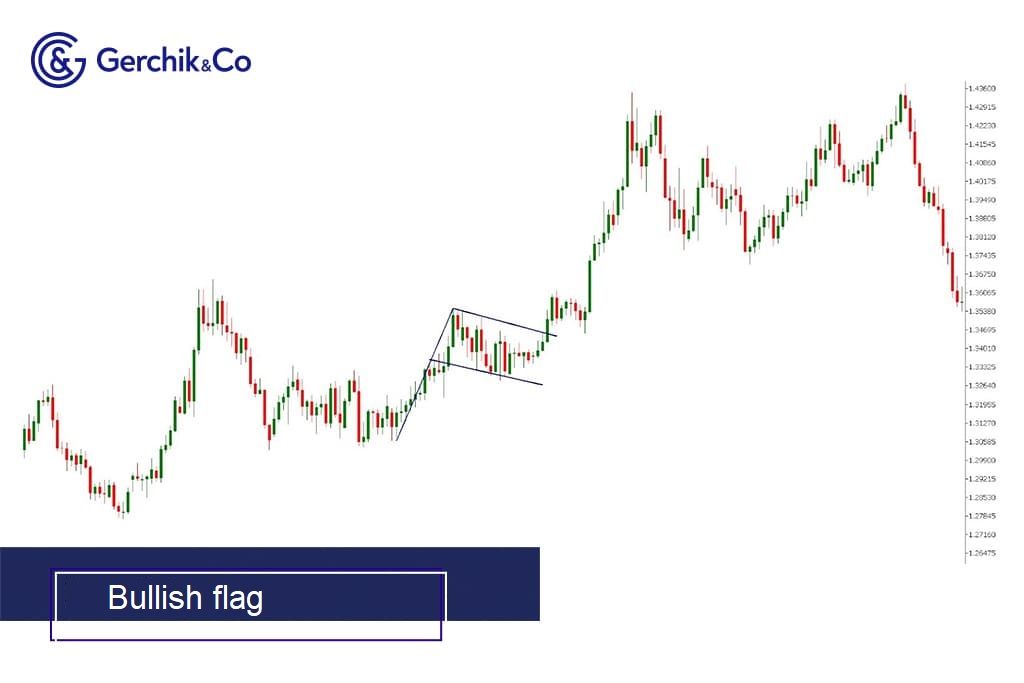
Flag is one of the classical patterns indicating a trend continuation. It consists of several large candlesticks (1–3) that form a long “flagpole” and a small “cloth” which is basically a price consolidation area. This pattern can be either bullish or bearish. The direction of the price is determined by the color of the candlesticks that form the flagpole. If they point to the growth, the price will continue to consolidate, and vice versa.


Why do flags form in the charts? Typically, this is linked to price impulses which form on the news. The price drops or surges dramatically which is then followed by consolidation. After that, there often comes another impulse.
Pennant is a trend continuation pattern that looks similar to the flag. It also has a “flagpost” formed by the bearish or a bullish candlestick. However, unlike the flag pattern, its “cloth” is in the shape of a triangle. It is as if the price was squeezed inside the triangle ready to spike in the direction specified by the “flagpost” of this pattern.


When the pennant pattern appears in the chart, positions are opened in a similar manner as in the flag pattern, except we have to wait for a breakout of triangle-shaped “cloth” instead of a horizontal rectangle. Profit targets are roughly the same, i.e. 80–100%. The stop loss must be placed right beyond the opposite level of the pattern.

Triangle is also considered a trend continuation pattern but not every single time. There’s a good reason why it’s called “servant of two masters” as the price can exit this pattern in any direction.
However, there are instances where the triangle works as the trend continuation pattern. This happens in the case of the ascending and descending pattern which coincides with the trend direction that it appeared in.


Both of these triangles will be rectangular. In the ascending triangle, the upper boundary will be horizontal, whereas the bottom one will be formed by upward-directed support. When it comes to the descending triangle, it is the other way round: the bottom boundary will be horizontal and the upper one will be a downward-directed resistance.
We can treat triangles as the trend continuation patterns in the following two instances:
1. If the ascending triangle is formed in a similar trend. In this case, when its upper boundary is broken out, you can open long positions. Profit potential will be 80–100% of the pattern’s width. The stop loss must be placed beyond the opposite level of the pattern.
2. If the descending triangle appears within the trend of a similar type. The breakout of its support will serve as a signal to open short positions. Stop loss and take profit are placed in a manner described in the previous example.
1. Learn the pattern formation rules and look for accurate patterns in the charts.
2. Enter positions based on the trading plans described above.
3. Do not violate risk management when trading.
4. To be 100% sure about the accuracy of your market entry, make sure to use the solution for technical analysis patterns available in the personal account on Gerchik & Co website.
Open an account with Gerchik & Co and embark on your trading journey now