Forex indicators are popular tools which are used to analyze the market. The problem is that there are so many of them that traders, let alone newbies, can easily get lost. Today, we are going to examine three indicators that will help to carefully assess the market situation and identify the right entry point.
1. Forex indicators: How to pick the best one
2. Bollinger Bands trend indicator
3. MACD on the lookout for reversal
4. Real Market Volume: Peeping behind the market’s curtain
In the MetaTrader 4 trading terminal, which is used by almost all forex traders, there is an indicator panel that includes over a dozen instruments. What’s more, you can also download the uniquely designed ones.
Depending on their function, these indicators are arranged into several groups. Forex trend indicators and oscillators are the most frequently used ones. In this article, we are going to examine the standard forex trend indicator, oscillator and uniquely designed indicator.
One of the best trend indicators is Moving Average (MA). Various trading strategies are developed based on combination thereof. On top of that, the Moving Average was used to create Bollinger Bands, a separate forex trend indicator.
This indicator is included in the standard list of MetaTrader 4 trend tools. All you need to do is place it onto the chart by using drag-and-drop technique. You can easily change the color, timeframe, offset and deviation parameters in the settings window. However, we will be considering examples with standard settings.
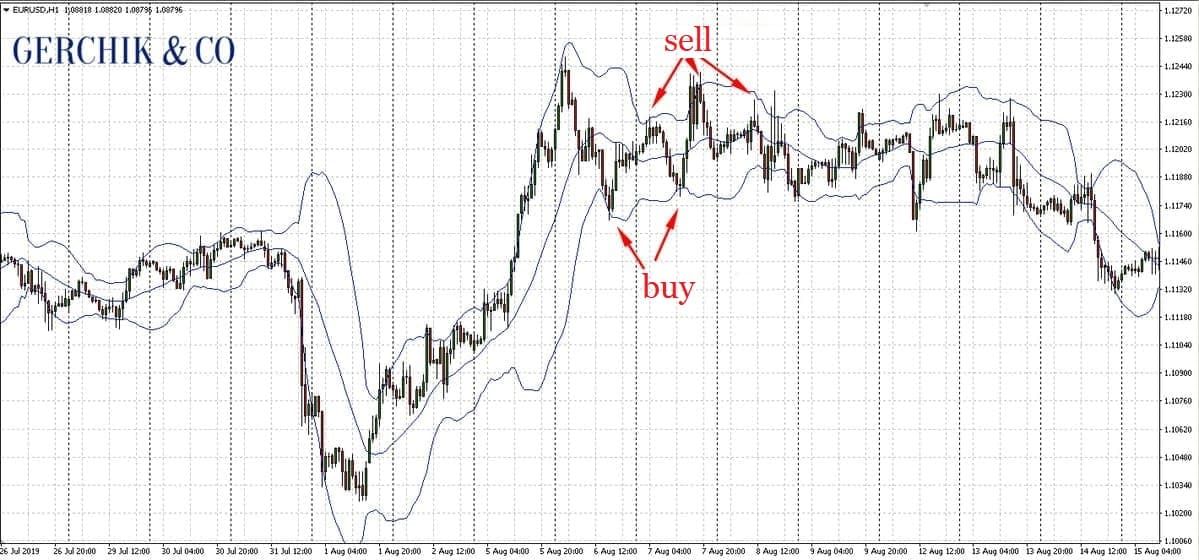
The Bollinger Bands indicator looks like a shaky horizontal corridor on the chart. When the market is flat, the boundaries of the indicator can be almost parallel. When the price spikes, they will expand and change direction.
When it comes to this forex indicator, one of the key strategies is trading within the corridor using its boundaries as support and resistance levels. This is best done when there is a horizontal (sideways) trend. When the price bounces upward off the lower boundary, you can open a long position. If it bounces downward off the upper boundary, you can go short.
.jpeg)
It is worth mentioning that the signals of the forex indicators can sometimes be misleading. This is why it is better to use several indicators that have different functions in order to filter off false entry points. In this scenario, you will open a trade based on two or three identical signals, which will help boost the profitability.
You can also couple the Forex trend indicators, including Bollinger Bands, with an oscillator. Let’s take MACD which is also available in MT4 for this. Once you install it onto the chart, you will see a window at the bottom of the timeframe.
MACD looks like a histogram crossed by a signal line. The location of the histogram below zero points to a downtrend in the market, and if it is above it, this means there is an uptrend.
.jpeg)
NOTE:
This oscillator’s task is to demonstrate the price reversal points.
One of the easiest ways to read MACD forex signals is to track how the signal line is crossed by the histogram. If the columns cross it from the bottom upwards, this means that the price is going to reverse into an upward trend, and you can go long. If the intersection occurs from top downward, the price is likely to reverse into a downtrend and it makes sense to go short.
You can download third-party forex indicators online. However, experienced traders prefer credible developers who understand both trading and programming and are capable of creating an indicator that will make trader’s work much easier. We are going to discuss one of them later.
The third forex indicator we are going to explore is Real Market Volume which reflects the market profile and allows seeing the power balance in the forex.
Thanks to the Bollinger Bands trend indicator and the MACD oscillator, we already have two signals confirming the entry point. We will get our hands on the third signal when we find out whether buyers or sellers are dominant in the market.
It is well known that the balance between supply and demand determines the price movement direction. If the majority of market players have opened long positions, they will push the quotes up and there will be an increase in the price. When the sellers dominate the market, the price drops.
But how can the forex trader acquire this data? You can get the information on the key players’ dominant positions from the CME exchange. But this is a long path. Good news is, there is a shortcut. Simply download forex indicators, namely the Real Market Volume based on the CME data.
Real Market Volume looks like a horizontal histogram demonstrating the price where the largest volume of buy trades is at, and where most of the sell trades are being opened.
Using this information, you can identify the strong price levels from where you can open short positions, and those from where you can go long.
(1).jpeg)
The market volume distribution helps to understand the direction in which big players will push the price and thus determine the trend. As you know, the task of the FX trader is to open the trades in the same direction.
To enhance your trading strategy with Real Market Volume, you need to download this forex indicator in your Personal Account and install it in the MetaTrader 4 trading terminal brought to you by Gerchik & Co. Thanks to RVM, you will have one more confirmation of the trade.
Protect yourself against the trading risks
using Risk Manager brought to you by Gerchik & Co!
Learn more about the service