1. What You Need to Know About the Stochastic Indicator
2. How to Set Up the Stochastic Indicator
3. Stochastic Divergence Signal
4. Intersection of Stochastic Lines
5. How to Use the Stochastic Indicator
The Stochastic indicator is one of the most popular forex indicators among traders. It is included in a standard set of tools in MetaTrader 4 trading terminal, and is used in various trading strategies.
The Stochastic indicator was developed by the famous trader John Lane in the 1950s. This indicator belongs to oscillators that give a signal of a market reversal.
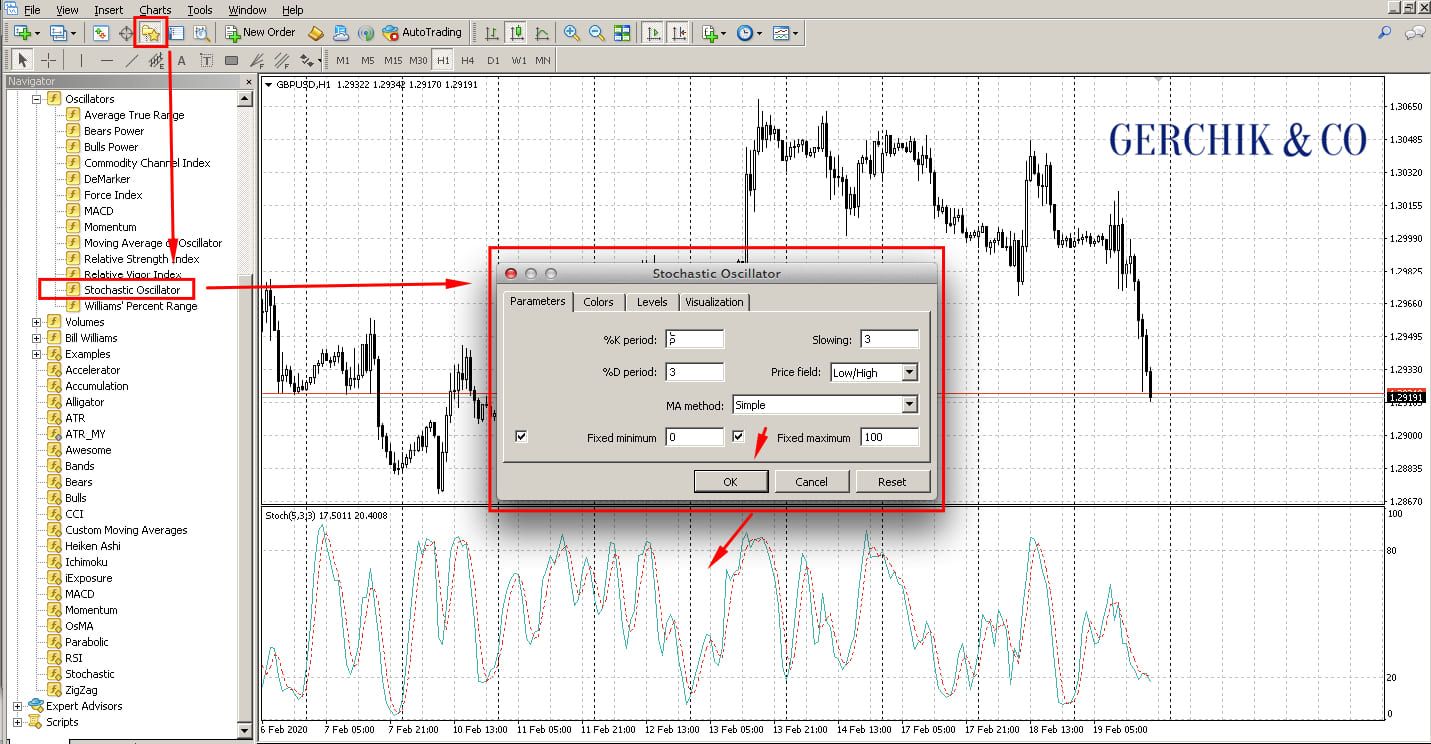
If you want to add this indicator to the chart, you should open the Navigator window in MetaTrader 4 and select it from the list of oscillators. Next, drag it onto the chart. A window with customizable indicator settings will open. Once installation is confirmed, the Stochastic Oscillator window appears below the chart.
.jpeg)
IMPORTANT!
If you want to add the Stochastic Oscillator to your trading system as a basis or an additional tool, you need to understand how to read stochastic signals correctly.
The Stochastic indicator is a tool designed to generate overbought and oversold signals. The indicator consists of two lines. In the settings window, you can see that one of them is marked with %K. It is considered to be the main line that is called fast.
The second line displayed as a dotted line is marked with %D. It is calculated as the moving average against the main %K line.
In the standard Stochastic Oscillator settings, the period of the %K line is set to 14, the period of the dotted moving %D is 3, and the standard deceleration can be 3. The line smoothing is the last parameter.
Note that you should select the most accurate Stochastic settings by trial and error depending on the trading strategy and the timeframe used. As previously mentioned, the Stochastic indicator belongs to the group of oscillators showing overbought and oversold areas. Thanks to these parameters, you can understand at what points a local or long-term price reversal will occur.
It is worth mentioning that the market becomes overbought and oversold when buyers (in the first case) or sellers (in the second case) are exhausted, and competitors are about to dominate.
There are two levels on the chart to help determine these price areas. The lower area, which is limited by the 20% line, is the oversold area. The upper one, which is above 80%, is the overbought area.
If you want to use the indicator correctly, you should understand that its entry into any of the areas is not yet a signal to open a trade. A trading instrument can be oversold or overbought for a while. You receive a signal to open a position when the Stochastic lines leave the area. Thus, when Stochastic Oscillator lines leave the oversold area (rising above 20%), it indicates that you can go long. When the lines leave the overbought area (dropping below 80%), it gives you a sell signal.

Use Real Market Volume Indicator
to make trading more efficient!
Learn more about indicator brought to you by Gerchik & Co
Stochastic signals help track divergence and convergence. Divergence is when the price and the indicator move away from each other, and convergence is when the price and the indicator move toward each other (sometimes convergence is called a type of divergence).
When you spot a bearish divergence pattern on the chart, you should open a short position. In this case, we see an upward movement and extrema going up on the price chart.
At the same time, we see the successively lowering maxima in the oversold area on the indicator chart. As you can see, divergence is followed by a price drop.

You can receive another type of signals to open a trade deal using the Stochastic indicator. These signals are generated when the lines of this indicator intersect in the oversold or the overbought area.
When the %K line crosses the dotted %D line and leaves the oversold area, this means that you should open a long position (buy). If the solid %K line crosses the dotted %D line and goes down from the oversold area, it makes sense to go short.

You now know how to read and interpret Stochastic Oscillator signals to open trades. That being said, with each trading strategy, it is better to have two or three tools at hand that can help identify the entry point, one of which will be the main one, and the other will produce additional signals either confirming or disconfirming the signals of your key method.
The Stochastic indicator can be used as an additional forex indicator when trading technical levels. You can use other oscillators with this indicator, e.g. the Relative Strength Index (RSI). It also generates signals to leave the overbought and oversold areas, as well as divergence, which will help you to pick the strongest one (where the stochastic and RSI signals coincide).
Would you like to make money in financial markets without trading?
If so, TIMA Service from Gerchik & Co is your best bet!
Learn more