Hello, dear readers! Today, we are going to talk about the concept of liquidity and its importance in trading and investment.
The chances are, you have already come across the concept of liquidity either in business or work. The classic term «liquidity» means the ability to sell an asset at a desired market price, or speed of its conversion into cash.
The above definition can be very well applied to the stock market where the majority of instruments are relatively liquid. That being said, this very relativity is the key factor for the investor and the active trader.
When it comes to large investors, the need to evaluate the liquidity of a financial instrument may concern the capital size. Low liquidity won’t let investor operate within the range of acceptable prices.
Their values are likely to be nowhere near the acceptable ones for the investor. This, in turn, is going to create certain problems for the asset portfolio and calculation of initially planned risk.
As far as the traders are concerned, the value of liquidity will have a direct impact on the entire mathematics of the trading system - even by a small position size - since relatively low liquidity may lead to position closing at prices which are nowhere near those that were calculated according to the risk.
For active traders who trade the probability, the statistics and mathematics of the trading system are the key pillar to evaluation of the trading approach effectiveness.
How to evaluate the liquidity of the instruments and what should be factored in when choosing a particular instrument? If we are talking about securities, the traded volume is the first thing that one needs to pay attention to.
For example, for intraday trading in the U.S. stock market, it is best to choose stocks with a daily turnover of more than 300 thousand dollars.
Everything is much easier when it comes to evaluating the liquidity of the Forex market because it is the most rapidly growing and most liquid market. Its turnover amounted to $5 billion in 1977, whereas by 2016 it totaled $7.5 trillion. That being said, there still can be hidden pitfalls in terms of relative liquidity.
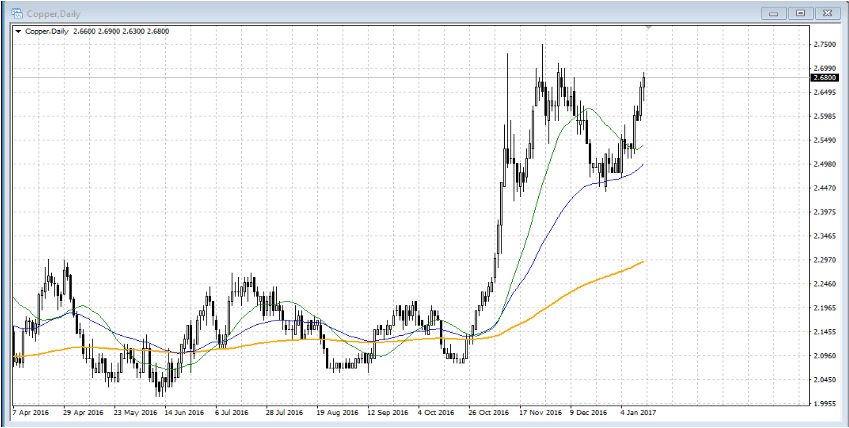
You can additionally evaluate liquidity visually on a timeframe. The screenshot demonstrates that the liquidity allows calculating risks and trading on the daily chart pretty seamlessly.
If the instrument is planned to be used for intraday trading, one should pay attention to the nature of the candles (bars) on the timeframe.
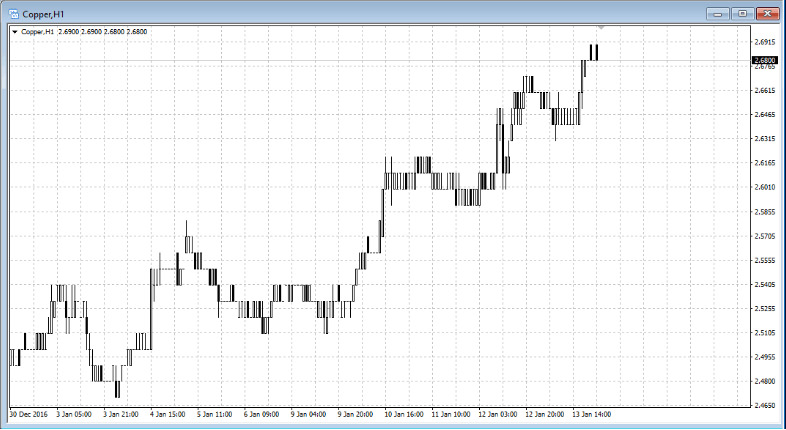
The visual features on the chart below demonstrate that relative liquidity on the hourly chart will most likely prevent you from closing position at predetermined and acceptable prices within the calculated risks.
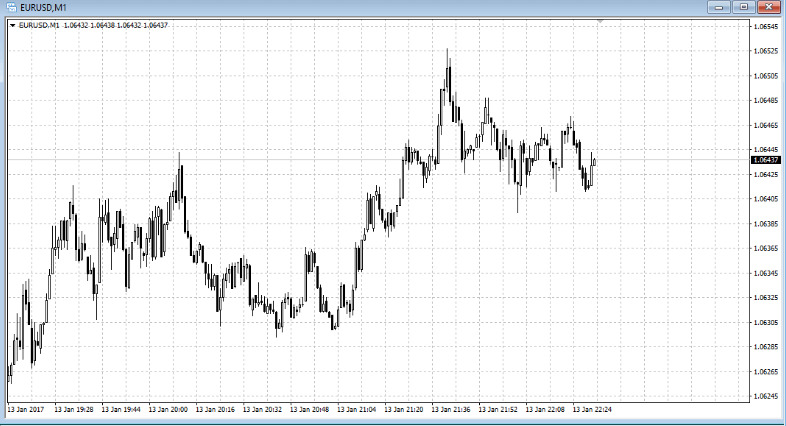
On the flip side, if we take EUR/USD which is one of the most liquid pairs, the instrument allows making trades with a startling capital size even on the minute chart.
We have the best liquidity and high-quality quotes!
Now you know what liquidity is, as well as how and why you should evaluate it. Pick the instruments with liquidity that is sufficient for your capital beforehand. In case the instruments and ideas come from the filter or selection done in the course of the trading session, make sure to visually evaluate the nature of the movement and unique visual features of the candlesticks.
Keep in mind that the risk management, along with the accuracy of position entry and exit price are the mathematics that lies at the heart of the trading system, and thus trading in the financial markets directly depends on it.
Login in Personal Account