In economic systems, financial intermediaries are active in borrowing and lending, while the net interest margin is the net lending profit.
Net interest margin is a measurement comparing the interest banks or other financial institutions receive with the interest they pay to lenders, e.g., in case of deposits, considering their earning assets.
Typically, we calculate this metric as a percentage of how much money a financial institution made out of loans over a given period and other assets minus the interest it paid for borrowed funds and divided by the average amount of earning assets over a given period (average earning assets).
Banks receive their interest from interest charges they get from outstanding loans. This consists of the lines of credit and loans in a financial institution’s balance sheet.
Interest paid is what a lender charges a borrower as part of a financial transaction. This is the cost of a loan or the interest on outstanding obligations. Customer deposits and wholesale financing are go-to examples.
The company’s earning assets are profitable investments that require no significant effort on the owner’s part. Earning assets include investments that generate the interest received: loans, stocks, bonds, and certificates of deposit. To calculate average earning assets, we need to use the average value of the opening and closing asset balance. Market players view this metric through the lens of the size of earning assets.
Financial intermediaries’ net interest margin is directly linked to interest rates. They change as the economic situation unfolds. The key factor that impacts the net interest margin is an increase in demand for borrowed funds or savings.
When interest rates are low, loans are in great demand, while the supply of deposits shrinks. Consequently, lending increases, while the deposit size decreases, thus boosting the interest received. Ultimately, the net interest margin will rise sharply and gradually decline over time.
As interest rates rise, demand for savings accounts increases in relation to loans, while the net interest margin decreases. This is because a bank will have interest charges that are higher than interest receivables.
Net interest margin that’s given as a percentage of earning assets is often confused with the term “net interest spread”.
Spread is the difference between the average rate a bank receives from assets and the average rate it repays. In other words, it’s the difference between the average rate it pays to depositors and the average rate it receives from borrowers. This is the average for all deposits and loans.
For instance, a bank may have different loan and deposit maturities, so its yield to maturity (YTM) may differ. Spread only demonstrates how profitable a bank can be in the coming years.
Net Interest Margin Formula = Interest Received - Interest Paid/Average Invested Assets
Spread Income = Interest Received/Average Invested Assets - Interest Paid/Average Liabilities Paid
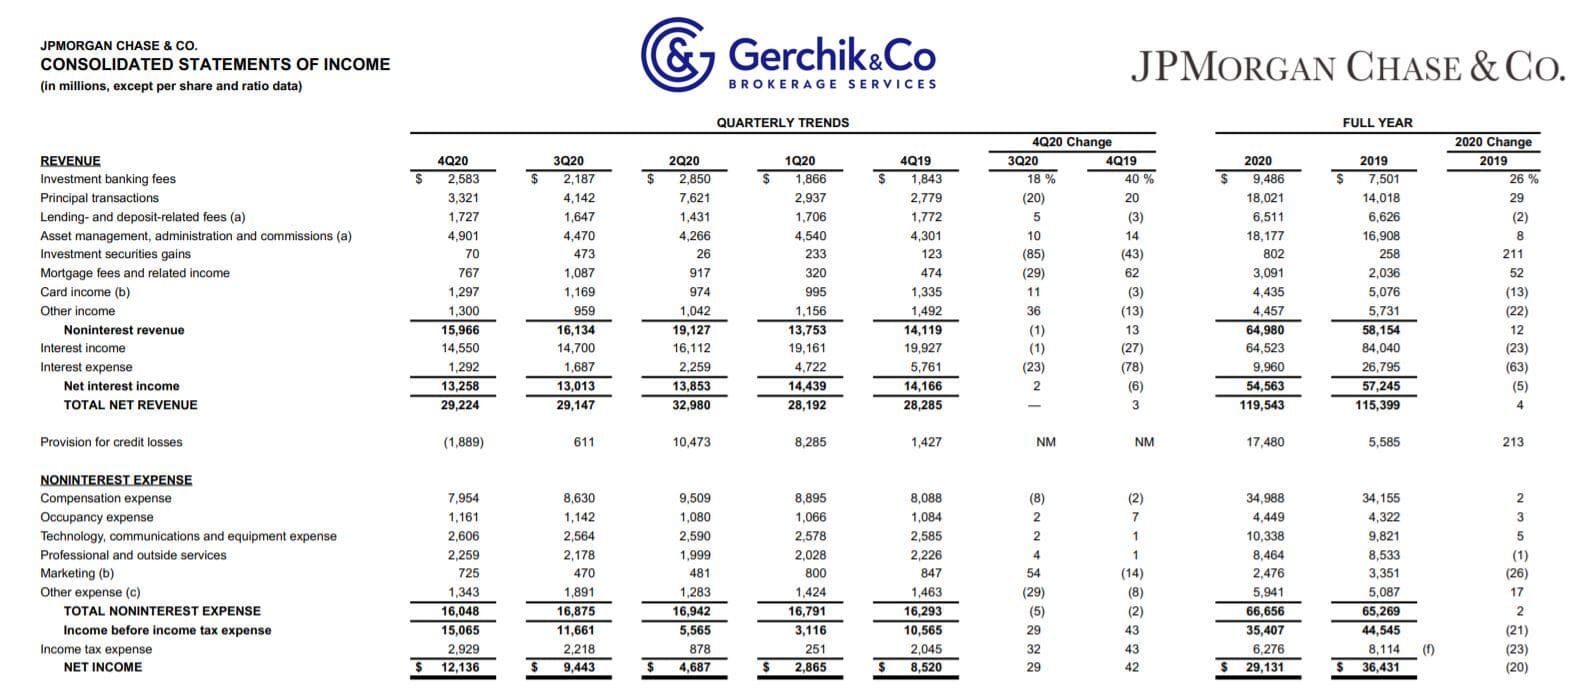
1. Let’s calculate interest income in the last 12 consecutive months (TTM) for the accounting year ended in December 2020:
(1).jpg)
Interest Income = $19,161 (Mar 2020) + $16,112 (Jun 2020) + $14,700 (Sep 2020) + $14,550 (Dec 2020) = $64,523
2. Now we will calculate interest expenses in the last 12 consecutive months (TTM) for the accounting year ended in December 2020:
Interest Expenses = $4,722 (Mar 2020) + $2,259 (Jun 2020) + $1,687 (Sep 2020) + $1,292 (Dec 2020) = $9,960
3. Let’s calculate Average Earning Assets in the last 12 consecutive months (TTM) for the accounting year ended in December 2020:
.jpg)
Average Earning Assets = ($2,465,649 (Mar 2020) + $2,819,689 (Jun 2020) + $2,874,974 (Sep 2020) + $2,955,646 (Dec 2020)) / 4 = $2,778,990
4. Let’s now determine net interest income:
.jpg)
Net Interest Margin = (Interest Income − Interest Expense) / Average Earning Assets = (64,523 − 9,960) / 2,778,989 = 54,563 / 2,778,990 = 1.96%
5. Let’s take a closer look at the dynamics of the figures. Until 2020, JPM’s net interest margin was steadily above 2.40%.
From an unbiased perspective, in 2020 net interest margin of the banks was under pressure. Regulators and the Federal Reserve System were forced to lower the interest rates in hopes to strengthen the economy. The year turned out to be incredibly challenging. Due to the increase in the unemployment rate and decline in production, the banks were obviously unable to play with high interest rates.
JP Morgan’s peak NIM was back in 2018 totaling 2.52%. Based on 2019 results, it was 2.46%. Throughout 2020, the net interest margin demonstrated by JP Morgan was steadily dropping with 2.37% in the first quarter, and 1.80% in the fourth. So far, this is the lowest margin in at least 7 years.
.jpg)
Open an account and start trading JP Morgan CFDs
Firstly, it’s supply and demand. If demand for savings accounts is higher than for loans, the net interest margin narrows (a bank pays more interest than it generates). Conversely, if demand for loans exceeds demand for savings accounts, the net interest margin expands.
Secondly, we have national monetary policies. Interest rate trends influence the consumers’ mood and decisions (take or save).
1. Net interest margin is the key metric for investors to estimate profits.
2. Banks must give guarantees: they can consistently lend money at higher rates than those that pay for their own funding source. This is the key to profitability.
3. Net interest margin is all about long-term profitability and business development: you can decide whether it’s risky to buy a specific stock.
⇐ Key to making money with shares. Lesson 17. Operating Cash Flow Margin. Google Key to making money with shares. How to pick stocks ⇒