In the previous lesson, we have explored operating margin. To have a complete grasp of the three major profitability ratios, today we are going to tackle the concept of net margin using the example of Procter & Gamble.
Net profit margin (or net margin) is a crucial profitability indicator measuring the percentage of revenue made by a company as a result of its total net sales during the reporting period.
In essence, net margin shows what percentage of sales has turned into profits over a given time period.
When performing an analysis, you have to carefully evaluate the net profit margin along with the gross profit margin and operating profit margin.
Net Profit Margin Formula = Net Profit/Net Sales х 100
It is essential that all three indicators come up to the mark. Only then can we be sure of the company’s normal profit margin.
Net profit margin is equal to net profit divided by total revenue typically expressed as a percentage. E.g., a 15% profit margin means that the company has $0.15 in net income for every $1 of revenue.
1. Net profit (net earnings, net income) is the amount of profit that remains after the production costs have been subtracted from revenue. In other words, this is sales revenue minus COGS (cost of goods sold), SG&A (selling, general & administrative expenses), depreciation and amortization, interest, taxes, as well as other expenses. You can find the relevant figures by checking out the profit and loss statement.
2. Net sales (revenue). The profit and loss statement starts off with gross sales i.e., the overall income made by the company. However, we need to subtract the amount of sales returns and allowances from gross revenue in order to find out the net profit.
You’ve got the following figures:
1. Let’s find out the net sales:
Net Sales = (Gross Sales – Sales Return) = (350,000 − 5,000) = 345,000
.jpg)
2. Using the formula, this is how we calculate the operating margin:
Net Margin = Net Profit / Net Sales * 100 (Net Profit / Net Sales * 100) = 20,000 / 345,000 * 100 = 5.80 %
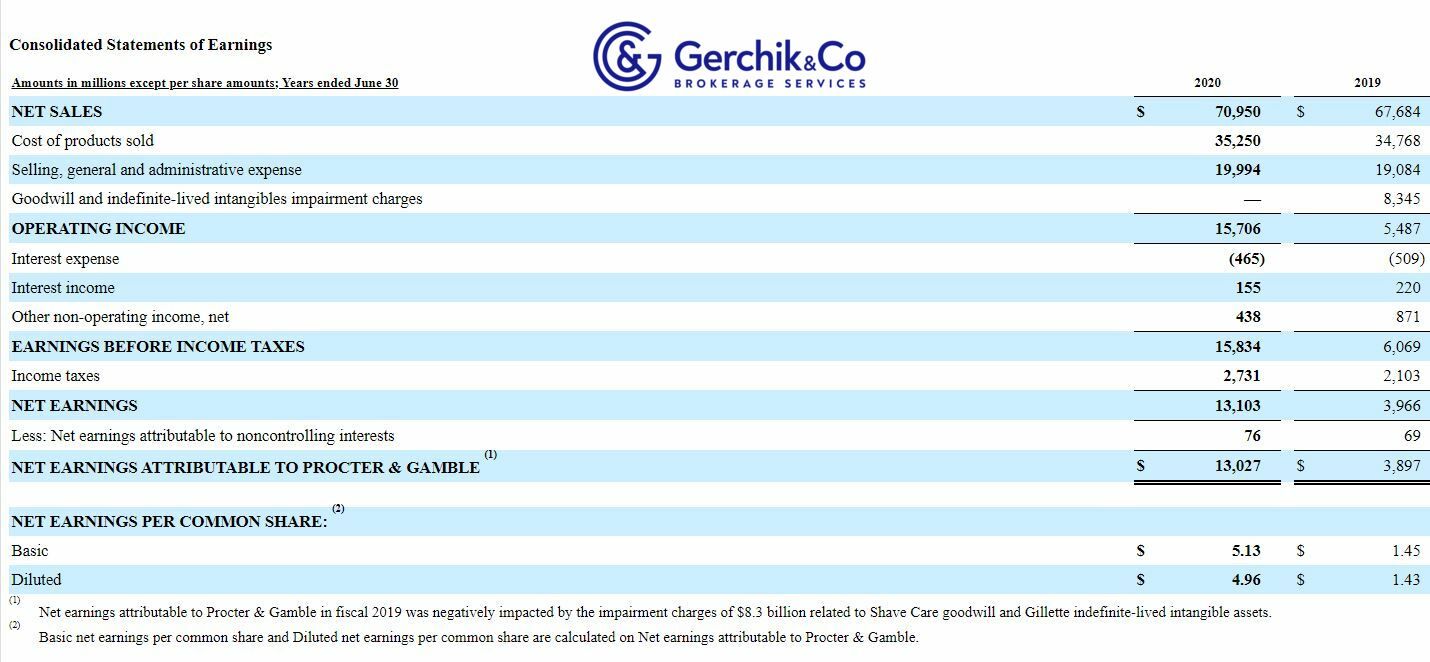
1. Procter & Gamble net margin for the accounting year ended in June 2020:
Net Profit Margin = Net Profit / Net Sales * 100 = $13,027 / $70,950 * 100 = 18.36 %
2. Procter & Gamble net margin for the quarter ended in September 2020:
Net Profit Margin = Net Profit / Net Sales * 100 = $4,277 / $19,318 * 100 = 22.14 %
.jpg)
In other words, Procter & Gamble generates $0.22 in net profit for every $1 of revenue.
3. Net margin Procter & Gamble is growing which is a good sign. As far as net margins go, P&G greatly surpasses 90% of consumer goods companies. The industry average is 2.93.
.jpg)
4. In real-time mode, Procter & Gamble’s net margin has been gradually increasing since mid-2019. Net margin has tripled since March 2020. The highest level of P&G’s net margin was in 2017 and totaled 23%.
.jpg)
1. The long-term trend of net margin is a great indicator that the company is doing well.
2. Publicly traded companies disclose their net profit margin during the release of reports. Businesses with growth prospects are typically encouraged by the stock price increase.
3. In cases where the net profit figures are less than net sales, you need to assess the situation and look into other information about the company.
4. If the net profit seems unreasonably high, it’s important to figure out the reason behind it. The net margin can be either consistent or grow.
5. Steady drop likely indicates that the company is struggling. By controlling the margin level, the investors can assess prospects beforehand and thus avoid losses in the future.
⇐ Key to making money with shares. Lesson 14. Operating Profit Margin Key to making money with shares. How to pick stocks ⇒