In technical analysis, the rounding bottom chart pattern is seen as one of the reversal patterns formed mainly on higher time frames. If you spot such a pattern in the chart in time, you can predict that the bearish trend is going to switch to the bullish one.
In our article, we shall explore what this pattern looks like and what signals it gives.
1. Rounding Bottom Chart Pattern: What Does It Look Like
2. Rounding Bottom Reversal Pattern: How to Trade It
3. Working with Rounding Bottom: Mistakes
The rounding bottom appears on higher time frames. Ideally, it’s better to track it on a weekly time frame. This is a smooth transfer of a downtrend to an uptrend with a pronounced basis (also known as the “bottom”).
The rounding bottom has three formation stages:
1. The price declines. In this case, the downward trend becomes more gradual when changing the angle.
2. The price goes flat as the pattern’s bottom starts to form. Candlesticks can be small in size. Here you can see a base or a bounce from a strong support level. In this case, the reversal signal gets stronger, while you can expect the price growth.
3. The price reverses and grows — this means that the rounding bottom is complete. Here you can see the bullish trend forming with an increasing angle of slope. It usually extends up to the same level where the downward trend started.
When the rounding bottom appears on the higher time frame, it can take a long time to work through on lower time frames. As this is a reversal pattern, traders should be primarily aimed at seizing the moment when the rounding bottom completes forming the “bottom” and the uptrend formation begins.
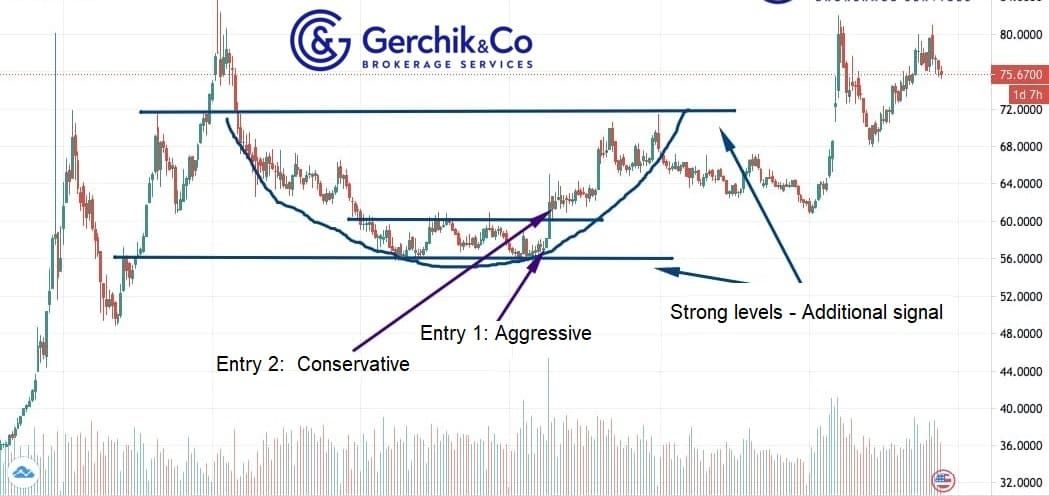
1. Aggressive and risky — from the “bottom” of the rounding bottom. You should identify the formed “bottom” and enter a long position, placing a small stop-loss that’s much lower than the minimum values of your “bottom”. In this case, you can make the most of the rounding bottom.
2. Conservative and safer — once the price starts to reverse. In this case, it’s better to open a long position after a new uptrend forms a downward correction.
3. The price growth goal is the left edge of the rounding bottom, i.e., the beginning of a downtrend.
.jpg)
The rounding bottom is a technical analysis pattern that can hardly be called autonomous. When trading this pattern, it’s better to use additional tools to confirm the price reversal.
Our students study the technical analysis patterns during a free training with mentor bot.
The rounding bottom chart pattern is just one of the tools used to identify the optimal entry points. The more tools you master, the easier it will be to choose the one that you’ll be using.
Login in Personal Account