- The flagliole;
- The flag itself.
Today’s article focuses on the flag and pennant patterns which commonly serve as a trend continuation patterns.
You will learn how the flag and pennant are formed on the chart, what precedes their occurrence, and how you can open the deals correctly when the pattern is confirmed on the chart.
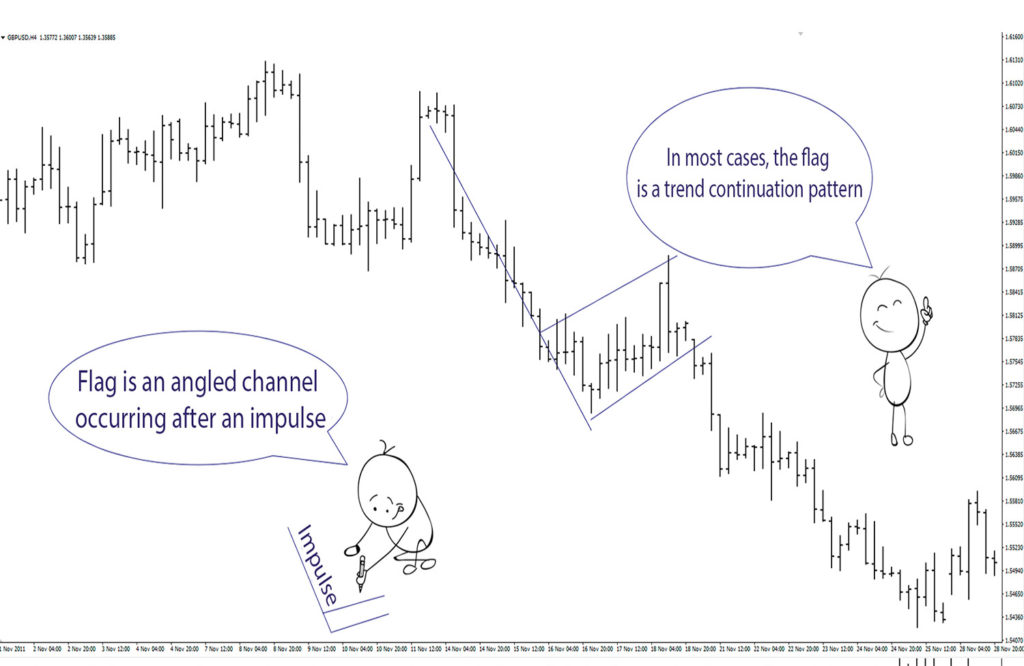
The flag is a pattern signaling the continuation of the previous trend and consisting of the following components:
There are two types of this model, namely upward sloping flag and downward sloping flag.
The formation of the flag in the Forex should, at all times, be preceded by a strong, purposeful movement of the price trend. This movement is the first component of the flag i.e. its flagpole.
After that, the price consolidates in a narrow slanted range which points to the fact that the market players have decided to take a rest and fix a portion of the profit following a strong movement.
As we can see, this price movement is limited by two parallel lines serving as angled support and resistance levels.
These lines face the direction opposite to the previous sharp price movement.
Even though the price movement should be limited by the parallel lines, there are not any clear rules which require a certain number of touches of these lines.
This means that the price should be consolidated in a slanted rectangle.
Now that we have familiarized ourselves with the flag pattern in the technical analysis, we have to figure out what steps should be taken when this pattern appears on the ascending and descending charts.
When the flag has formed on the ascending chart, we have to wait until its upper line is broken out. After this, we wait until it is confirmed that the price has exited the boundaries of the pattern.
The piercing candle closing above the dynamic resistance line will serve as the above confirmation. When the candle closes, long positions can be opened in the trend direction.
First, however, we have to find out what we are risking in this deal and what we can get as a result of the expected price increase.
When trading the flag pattern during an uptrend, the stop loss order is placed slightly lower than the bottom boundary of the flag.
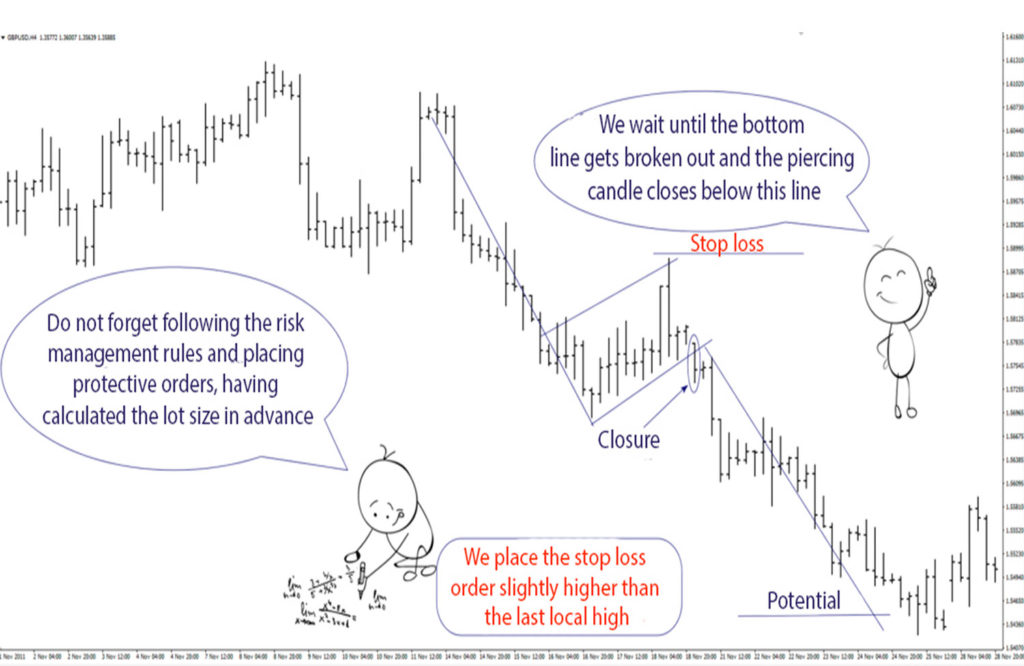
To determine the movement potential of the price after exiting the flag boundaries, we need to measure the distance from the beginning of the flagpole to its end.
In other words, the movement potential after the flag is pierced is equal to the amount of movement preceding its formation.
There is another way to enter the deal.
After the resistance level is pierced, we have to wait for the price to roll back to this level, which after the breakout becomes a support level. The price should rebounce off it and continue the upward movement.
If the flag is a downward sloping model, you have to trade according to the same principles as in the upward sloping model.
Next up, let’s review the pennant pattern which in many ways forms similarly to the flag pattern. The pennant is also a trend continuation pattern.
The pennant can be both bullish and bearish.
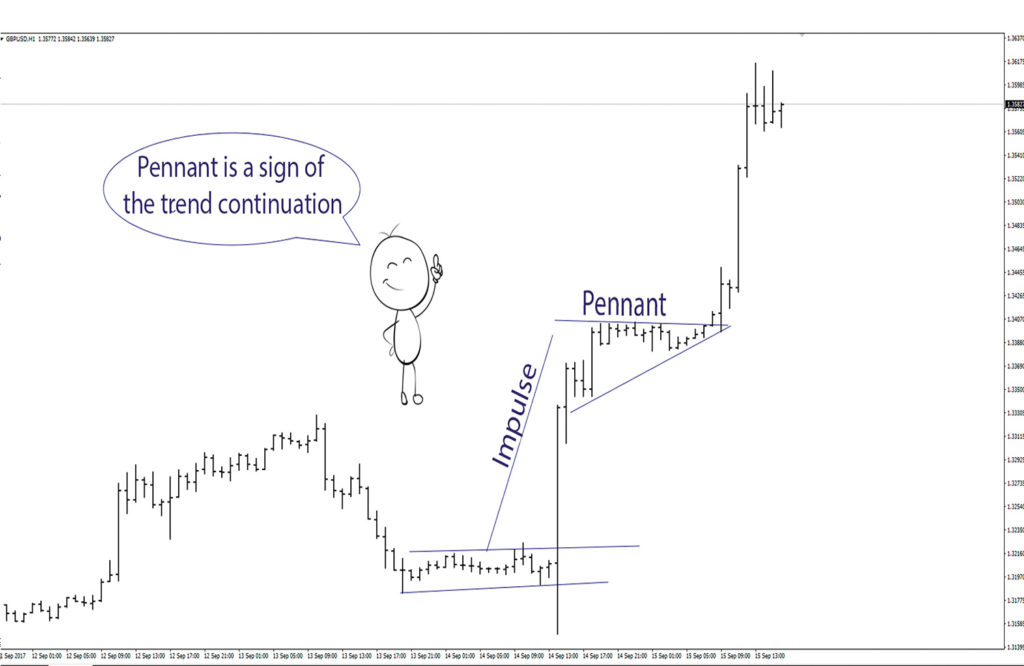
The appearance of the pennant on the chart is preceded by a strong trend movement - just like before the flag - which will serve as a flagpole for the pennant.
This is followed by correction, through the highs and lows of which we can draw two converging lines that form a small symmetrical triangle. The lines that form the borders of the pennant are facing different directions: one upwards, and the other one downwards.
When a pennant pattern appears in the Forex, the same trading rules apply, similarly to the flag. When the pennant is observed on the ascending chart, we wait until the upper line is pierced, and the piercing candle closes above this line which is the resistance level.
Stop loss order is placed slightly below the last local low.
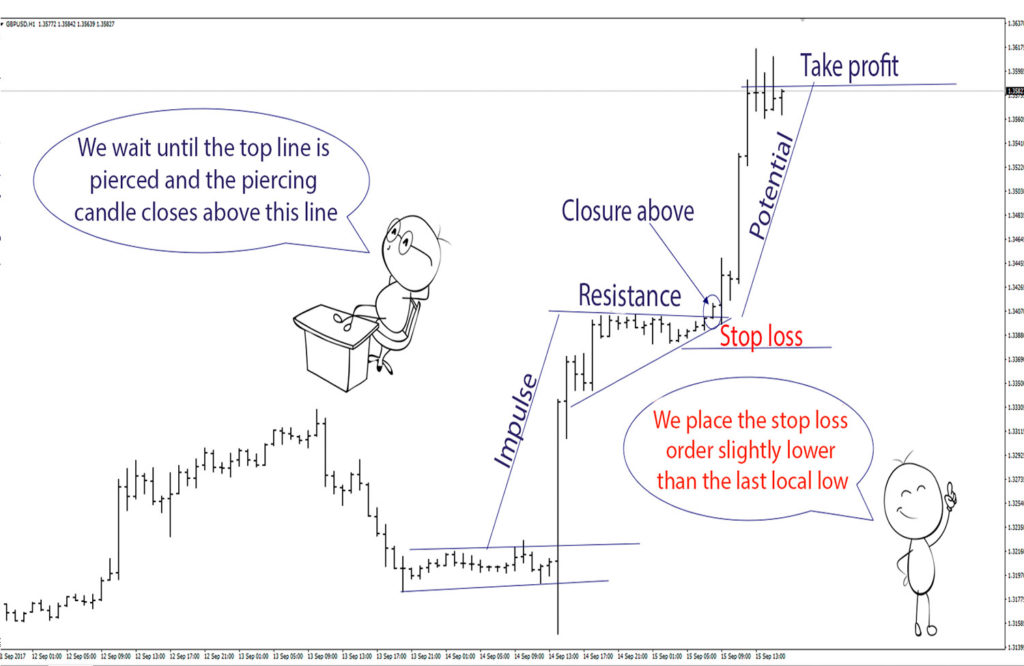
The movement potential for the pennant, as in case with the flag is determined by measuring the distance from the base of the flagpole to its top.
This very distance is the movement potential after the price exits boundaries of the pennant. If the pennant is formed during a downtrend, we can take similar steps as in the case of an upward sloping pennant, although we have to open the deals in the direction of the downtrend.
In this article, we have reviewed flag and pennant patterns indicating the trend continuation.
Also, we gained an insight into what a flagpole is, when we can open a deal, where the stop loss order should be placed and how the profit potential can be identified following confirmation of this pattern.
Login in Personal Account