This article reviews the Double Top and Double Bottom patterns, providing an insight into how they look on the chart, when they are formed and what they indicate.
We are going to learn what to do when this pattern is confirmed, how to open positions, where to place the stop loss order and how to identify price movement potential after entering the trade.
Double Top and Double Bottom are reversal patterns, since they indicate the ending of the previous trend and the beginning of the opposite one.
This is why, this pattern shall be formed on the highs of the movement by an uptrend and on the lows by the downtrend.
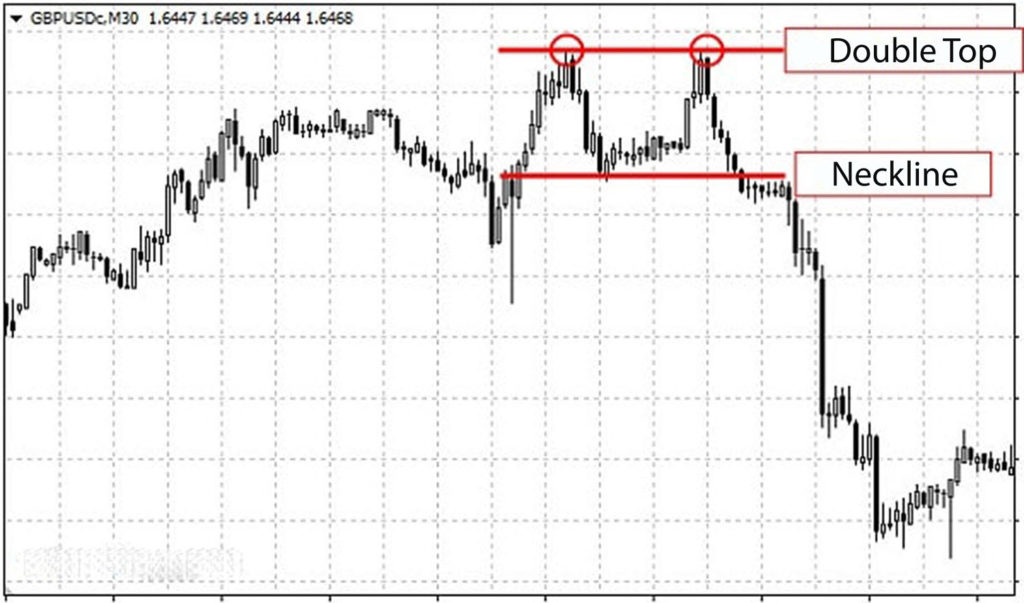
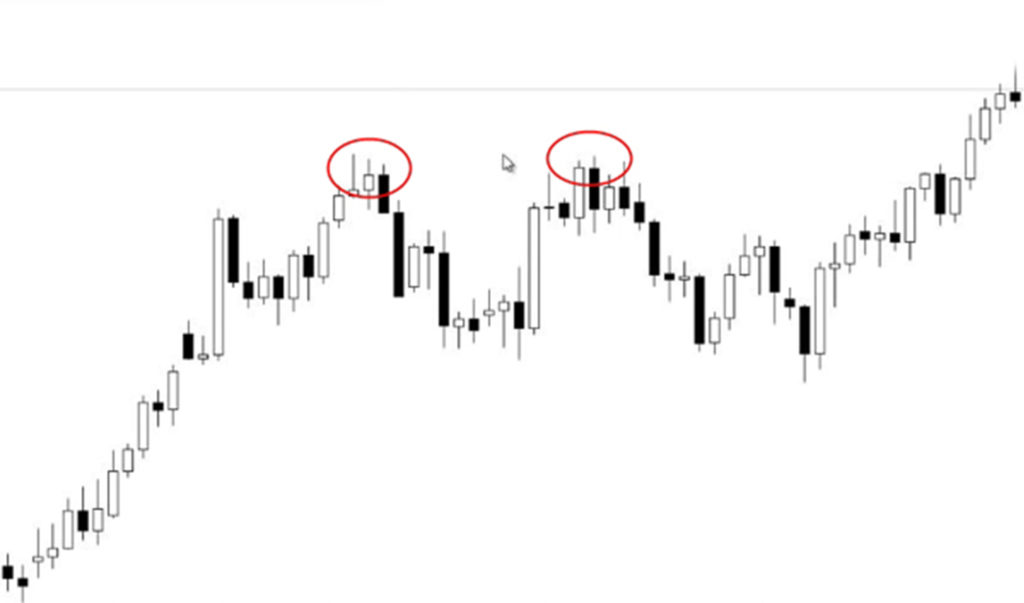
Let’s begin with the Double Top. Since it is a reversal pattern, before it is formed on the chart, there has to be a prominent upward movement of the price, evidencing the dominant force of the buyers.
The first peak of the pattern formed on the chart is the high of the uptrend, whereupon the price rolls back and reaches the local low.
This means that on this level there are buyers who expect the uptrend to continue and not let the price drop lower.
Then, under the pressure of the buyers, the price goes up again, but when it approaches the price level, near which there is the first peak, the buyers encounter the sellers’ resistance.
This results in formation of the second peak on the chart. In the classical pattern, the two peaks are on the same level; however, in truth, such a coincidence does not always happen. The second peak can sometimes exceed the first one or not reach it.
Once the buyers run out of their resources, the sellers start to apply pressure and reduce the price to the local low which was drawn after the first peak.
If they turn out to be stronger than the buyers on this level, the price will drop below the local low indicating the final reversal of the trend.
In the financial markets, the profit can be achieved by accurately identifying the price movement direction.
For this purpose, a lot of experienced traders have recently preferred trading without indicators using price action strategy. Since no indicators are used in it, the trader makes his or her forecasts based on the price chart behavior.
When observing the price, certain patterns have been noticed which are constantly repeating on the chart and are equally tested in the market regardless of the financial instrument.
All price patterns are divided into two following large categories:
o matter what group the pattern that you are using belongs to, each of them has its own trading rules and a certain price movement potential. Being aware of the features of a particular price pattern, the trader has every chance to profit in the market.
A rule of thumb states that the use of important price levels along with graphic models allows getting a stronger signal for position opening in the Forex market.
There are trend continuation patterns, as well as those indicating a trend reversal in the market. One of the most popular reversal patterns is the Double Top price pattern, shortly referred to as the DV.
Depending on the trend during which this pattern formed, it is also called the Double Bottom. So, for instance, if the upward trend prevailed, the Double Top bearish pattern will be formed here. In contrast, if the downtrend prevailed, the pattern is called the Double Bottom.
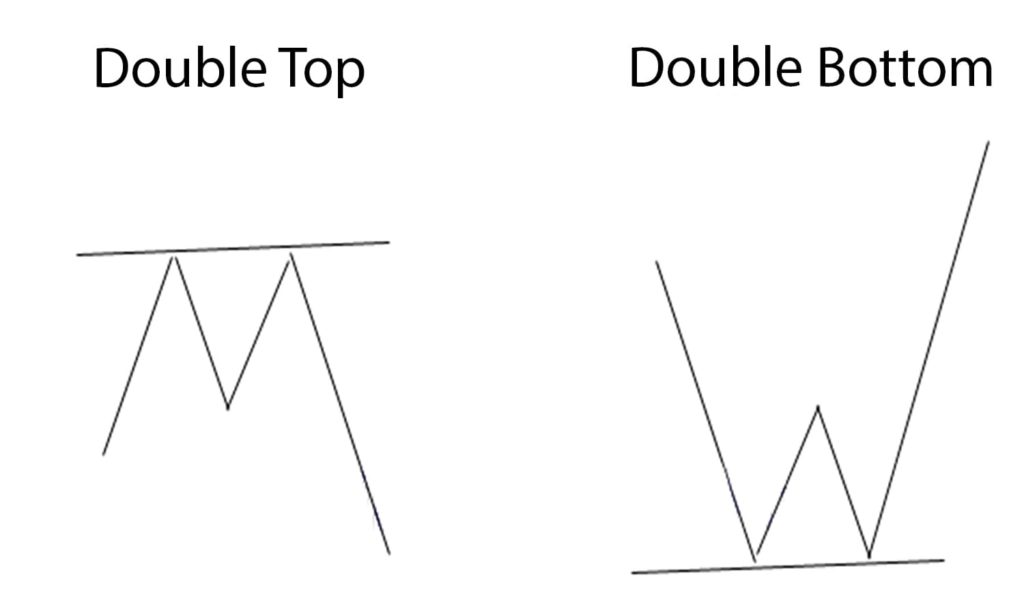
Regardless of the market which this model was formed in, it comprises of two extremums, between which there is a small price rollback. A major feature is that the second peak must be at the level of the first peak - the extreme point of touching - indicating that a strong player is present in the market.
If the pattern appeared on an important price level, this only strengthens the signal from this setup. Moreover, the distinctive feature of the pattern is that the second peak should not go right after the first one.
The bigger the time interval for the pattern formation, the better it will work in the market. The Double Top or Double Bottom can be found on literally any timeframe. However, from the daily chart, the setup will be much stronger than from the half-hour chart.
Since the Double Top (Double Bottom) appears in the market very frequently, some traders prefer trading only this pattern. For it ensures great profit by minimum risks, and you always know where to place protective orders.
Just like in other price action trading setups, the pattern can be traded both conservatively and aggressively.
In case of aggressive trading, the position is opened immediately, once the candle closes behind the rollback level following the formation of the second peak. In this case, the stop loss order has to be placed above the second peak.
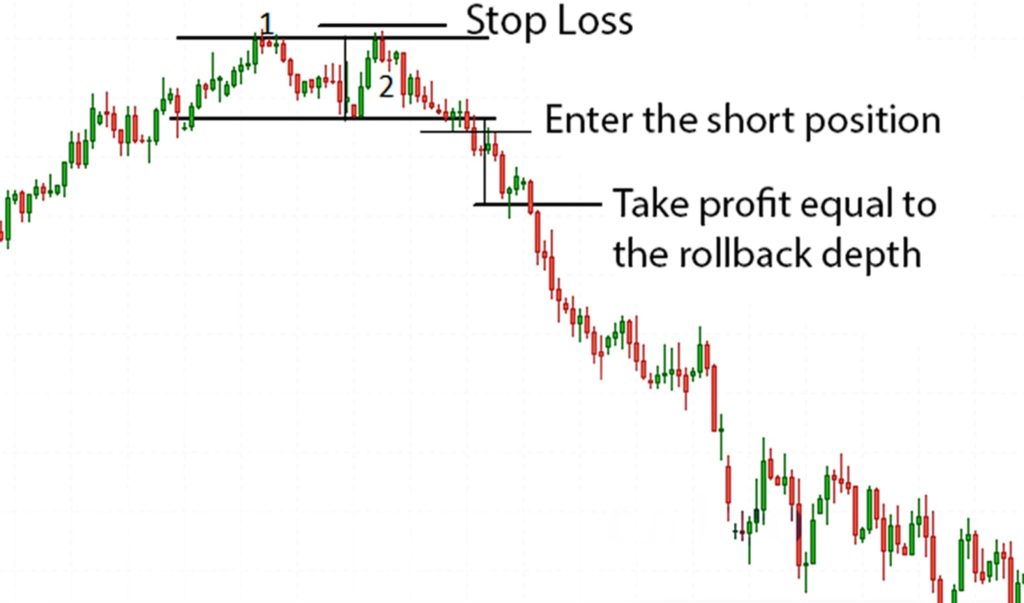
In case of conservative trading approach, the position is opened, when the rollback level was broken out, and the price tested this level from the opposite side. In this case, the stop loss order is placed behind the price rollback, which performs the testing after the breakout.
Just like in the first case, the availability of a second peak at the level of the first one (the extreme point of the level touching) is the key condition here. According to this trading method, the price does not necessarily return to test this level which reduces the amount of profitable entries considerably.
Both in the first and the second case, the potential profit equals to the amount of the rollback laid from the point of price breakout.
The usage of different price action strategy setups allows the trader to receive a stable profit in the Forex market. One has to know and understand how a specific price pattern works, and where to expect the take profits.
Depending on the current market trend, the Double Top or Double Bottom are the most common reversal patterns in the financial markets.
Having examined this pattern, the trader has a chance to receive a stable profit as a result of the trading activities, use minimum risks and place sensible stop loss and take profit orders.
Keep in mind that the formation of Double Top close to important price levels only strengthens the signal from this pattern. In addition, the larger the time frame, the more important the pattern.
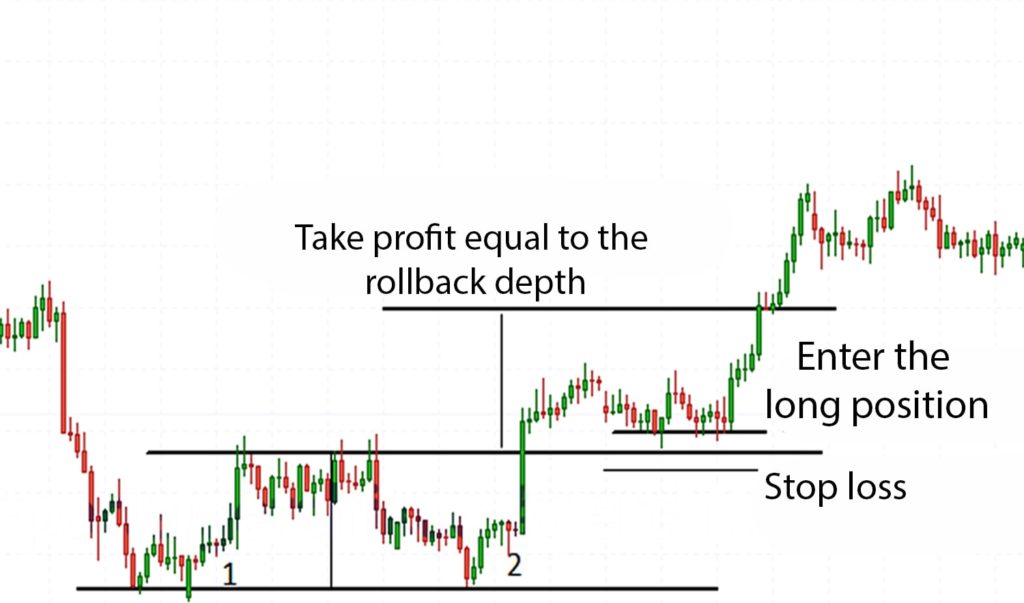
The Double Bottom pattern is formed according to the same principle as the Double Top, just the other way round. Double Bottom chart pattern indicates the reversal of a downtrend and its end.
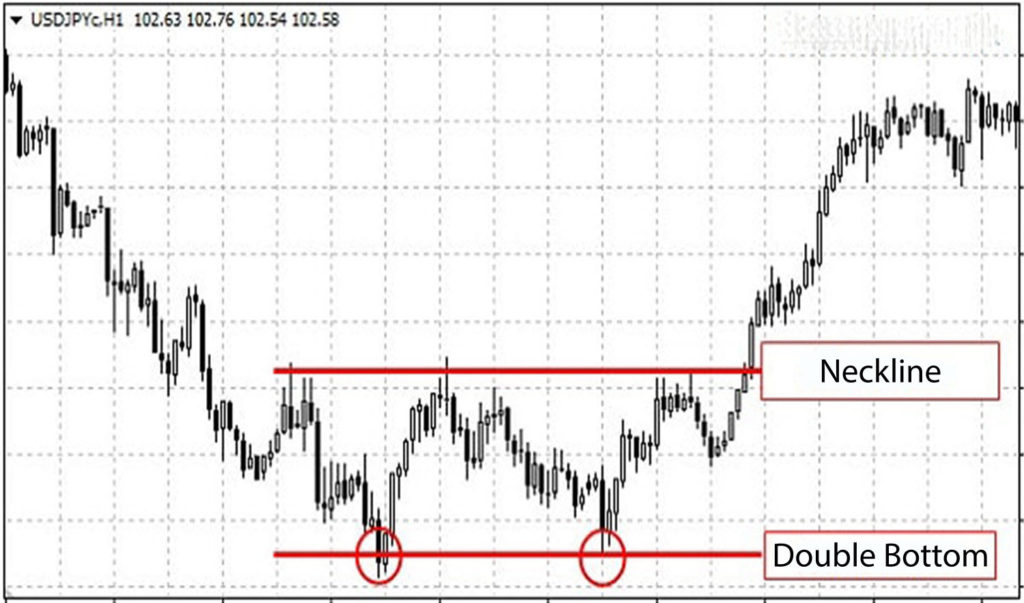
After a long downward trend, the price reaches its low and then goes up.
This is how the local high is formed, where the sellers show that they still have got the power, which makes the buyers eventually back off; the price continues to drop and a second bottom is formed.
When approaching the price level where there is the first bottom, another confrontation takes place, wherein the buyers defend their positions and make an attack.
The price goes up and approaches the level of the local high. If it breaks it out, it is highly likely that the trend reversed from the downward to the upward.
In order to identify the price movement potential after it exits the boundaries of the Double Top pattern, we have to measure the distance from the high of the two peaks to the local low.
As the experience of many traders shows, the potential price movement is equal to this distance in the majority of instances. Therefore, the traders use this consistent pattern as a rule for placing the take profit order.
In the similar fashion, we can calculate the price movement potential after the resistance level in the Double Bottom pattern is broken out. In this case, we measure the distance from the lows to the local highs between them.
Now let’s figure out how to open positions and where to place the stop loss order when this pattern shows up on the chart. There are several ways to achieve that by formation of the Double Top and Double Bottom patterns.
As an example, let’s explore the ways to open the position upon the availability of the Double Top pattern in the Forex market:
When it comes to the Double Bottom in the technical analysis, the same position opening methods are applied, except in the opposite direction.
In this article, we have analyzed how the Double Top and Double Bottom patterns form on the chart, touched upon the methods for entering the trade and the rules for determining the price movement potential after these patterns get confirmed.
The usage of different price action strategy setups allows the trader to receive a stable profit in the Forex market. One has to know and understand how a specific price pattern works, and where to expect the take profits.
Depending on the current market trend, the Double Top or Double Bottom are the most common reversal patterns in the financial markets.
Having examined this pattern, the trader has a chance to receive a stable profit as a result of the trading activities, use minimum risks and place sensible stop loss and take profit orders.
Keep in mind that the formation of Double Top close to important price levels only strengthens the signal from this pattern. In addition, the larger the time frame, the more important the pattern.
Login in Personal Account